Brackets Tutorial 5: Advanced Cardboard Aided Design: Difference between revisions
| Line 54: | Line 54: | ||
The image below is a rendering of the first ("good") image that has been saved as a monochrome bitmap as in Tutorial 4. The corresponding rendering from the second ("bad") image isn't shown because the two are almost indistiguishable, except by careful measurement. | The image below is a rendering of the first ("good") image that has been saved as a monochrome bitmap as in Tutorial 4. The corresponding rendering from the second ("bad") image isn't shown because the two are almost indistiguishable, except by careful measurement. | ||
[[File:Tut5_re-rev-eng_bracket_pic_blowup+contrast.png|500px|B-W image]] | [[File:Tut5_re-rev-eng_bracket_pic_blowup+contrast.png|center|500px|B-W image]] | ||
Revision as of 16:20, 2 December 2024
Link to: Bracketage Main Page
Introduction
This tutorial covers a photographic technique for gathering data from an existing part. As an example, we use one of the sheet-metal blanks from Tutorial 2b. Digital photography straddles the digital and analog domains. We will show how to gain the best precision from using the software tools to convert a photo into a CNC program.
Camera Stand
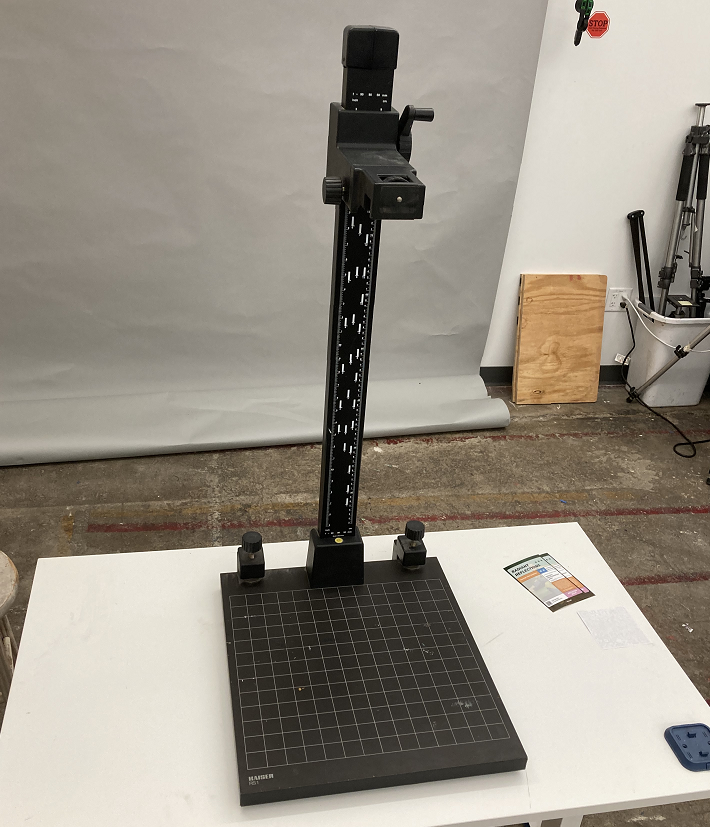
A good quality camera stand (Kaiser RS-1) can be found in the Photo/Design shop at Artisans Asylum. With the camera mount moved all of the way to the top, the field of view with an ordinary camera is about 40 inches (1 meter) wide and about 1/2 that in height.
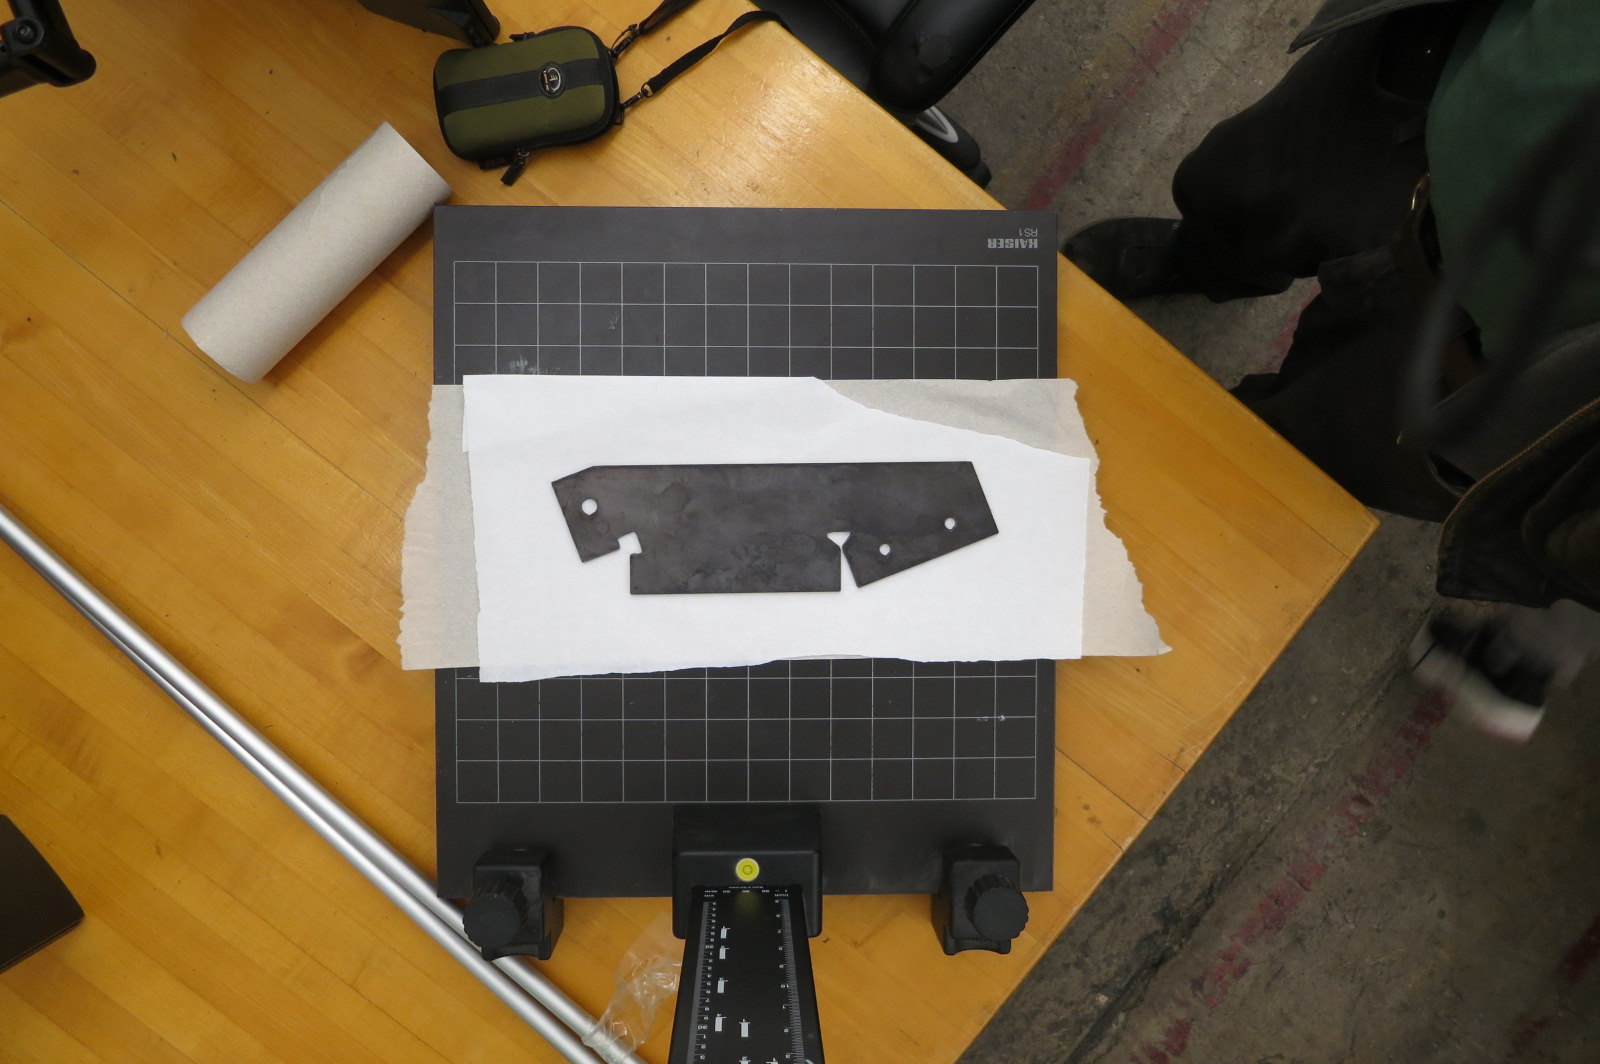
A dark, unfinished steel bracket blank has been placed on a white paper background and photographed with an undistinguished digital camera. The resolution of the image is 35.3 dpi, or 0.72 mm per pixel. This calculation can be done in a variety of ways. The most immediately available is in the "Paint" application that comes with Windows. This application tells you the pixel location of the cursor, so the width of the grid in the photo (in pixels) can be compared with its known size. The grid squares are 30 mm in size, and the field is 14 squares wide (420 mm).
Image Analysis
As in the previous tutorial, we will use "Paint" to convert the image into a high-contrast black-and-white bitmap image. Let us examine in detail what happens to the image when we do this.
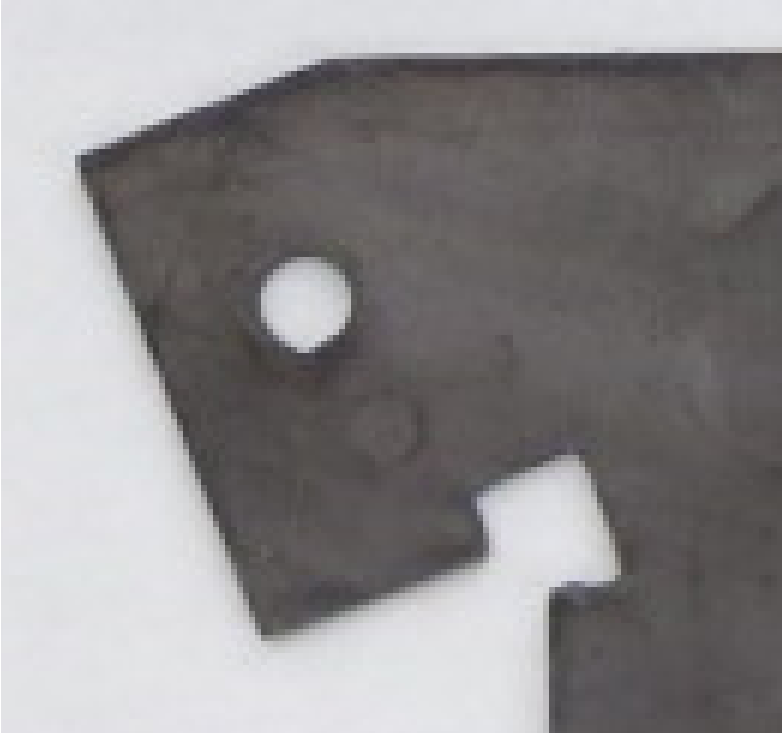
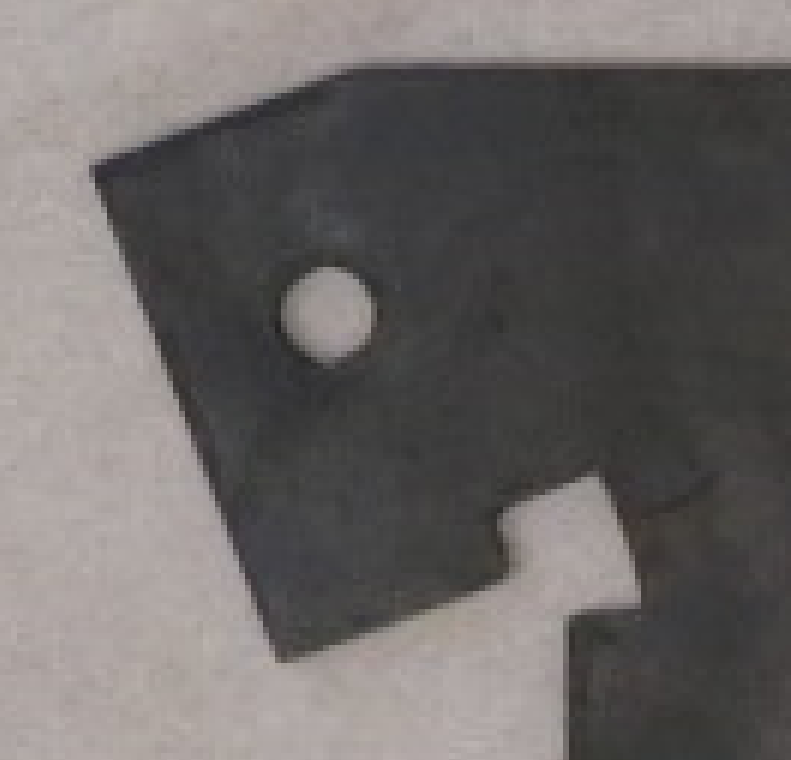
Below are two images taken with the same camera at different times. Notice that the demarcation between the light areas and the dark area isn't sharp. This isn't an error in focusing the camera. It is a consequence of modern digital photography, which purposely blurs out a boundary like this using a scheme known as "anti-aliasing." This creates a boundary that appeals better to the viewer's eye without the jagged steps that the individual pixels make with one another. Unfortunately this scheme imposes a loss of accuracy that we must seek to regain when we use the camera as a measuring instrument instead of an artistic tool.
Using "Paint" to create a monochrome bitmap is sort of a "sledgehammer" approach to generating the high-contrast image. The application sets up a threshold at the 50% gray level and sets all pixels below that value to black, and the rest to white.
More sophisticated image processing applications such as Adobe Photoshop will allow you to set a threshold at some other value besides the exact middle, and the following discussion will show why this is desirable.
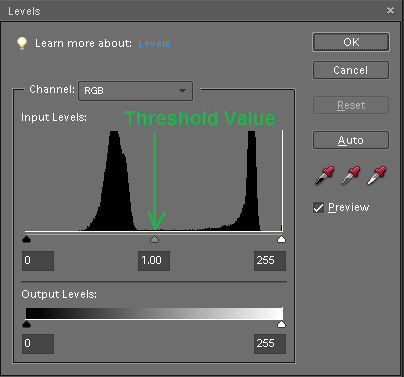
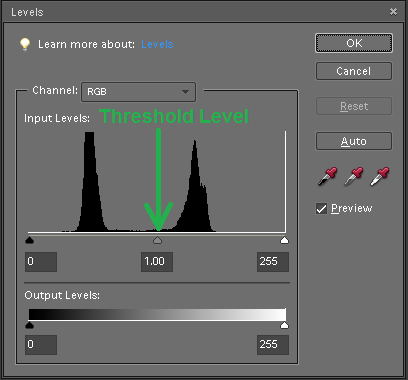
A detail of the image shown above is displayed below, left. Next to it there is a histogram of the pixel values in the image, captured using Adobe Photoshop.
On another occasion the same piece was photographed with the same camera in lower light, and using a grayish paper towel as a background instead of a piece of white paper. A detail of the resulting image is shown below, with the corresponding histogram.
A comparison of the two images shows that the first is uniformly lighter and the second is uniformly darker. The histograms for both images show two peaks (a "bimodal" distribution) with little or no overlap, where the curve to the left indicates the values in the dark part of the image and the curve to the right indicates the values in the light part of the image.
Examine the histograms more closely. Notice that the curves in the graphs aren't sharply defined, but rather they have relatively long "tails" that extend in both directions away from the peaks. Notice also that in the first image, the threshold value (50% gray) falls in a relatively unpopulated region between the tails of the two peaks in the histogram. In the second image, the threshold value falls upon part of the tail of the curve on the right.
For the first image, the division between "black" and "white" areas is relatively clean. With the second image, we find points that should be in the "white" population will erroneously be assigned to color black. The pixels in this population are all located within the boundary between the light areas and the dark area. The net result of the error causes the dark region of the image to bleed outward beyond the boundary where it ought to be confined.
Please note that both images to be used to design virtually identical replicas of the pattern. As the discussion progresses we hope the reader will begin to understand the difference between "accuracy" and "precision." The second image is less accurate than the first image, but they are almost equally precise. With careful manipulation the difference in accuracy can be cured, thanks to the precision of the images.
Monochrome Bitmap
The image below is a rendering of the first ("good") image that has been saved as a monochrome bitmap as in Tutorial 4. The corresponding rendering from the second ("bad") image isn't shown because the two are almost indistiguishable, except by careful measurement.
