Brackets Tutorial 5: Advanced Cardboard Aided Design: Difference between revisions
No edit summary |
|||
| (34 intermediate revisions by the same user not shown) | |||
| Line 4: | Line 4: | ||
=Introduction= | =Introduction= | ||
This tutorial was written during the Great Solidworks Blackout between Oct and Dec 2024. If you want to study Solidworks, please view the [[:Category:Bracketage#Solidworks_Tutorials | Solidworks tutorials]] elsewhere. | |||
This tutorial covers a photographic technique for gathering data from an existing part. As an example, we use one of the [[:Brackets_Tutorial_2b:_Fabricating_a_Bracket_from_a_Solidworks_Design#Sheet_Metal_Blank | sheet-metal blanks]] from Tutorial 2b. Digital photography straddles the digital and analog domains. We will show how to gain the best precision from using the software tools to convert a photo into a CNC program. | This tutorial covers a photographic technique for gathering data from an existing part. As an example, we use one of the [[:Brackets_Tutorial_2b:_Fabricating_a_Bracket_from_a_Solidworks_Design#Sheet_Metal_Blank | sheet-metal blanks]] from Tutorial 2b. Digital photography straddles the digital and analog domains. We will show how to gain the best precision from using the software tools to convert a photo into a CNC program. | ||
| Line 13: | Line 15: | ||
=Photography= | =Photography= | ||
A good quality camera stand (Kaiser RS-1) can be found in the Photo/Design shop at Artisans Asylum. With the camera mount moved all of the way to the top, the field of view with an ordinary camera is about 40 inches (1 meter) wide and about | A good quality camera stand (Kaiser RS-1) can be found in the Photo/Design shop at Artisans Asylum. With the camera mount moved all of the way to the top, the field of view with an ordinary camera is about 40 inches (1 meter) wide and about half that in height. | ||
A dark, unfinished steel bracket blank from Tutorial 2b has been placed on a white paper background and photographed with an undistinguished digital camera. Some care has been taken to avoid the presence of shadows inside the slot in the lower right of the blank, which is about 1/8 inch thick. | A dark, unfinished steel bracket blank from Tutorial 2b has been placed on a white paper background and photographed with an undistinguished digital camera. Some care has been taken to avoid the presence of shadows inside the slot in the lower right of the blank, which is about 1/8 inch thick. | ||
| Line 26: | Line 28: | ||
==Image Analysis== | ==Image Analysis== | ||
As in the previous tutorial, we need to convert the image into a high-contrast black-and-white bitmap. Tutorial 4 showed how to use "Paint" | As in the previous tutorial, we need to convert the image into a high-contrast black-and-white bitmap. [[:Brackets_Tutorial_4:_Basic_Cardboard_Aided_Design#Inverting_the_Contrast |Tutorial 4]] showed how to use "Paint" in an unsophisticated approach with few options. The application sets up a threshold at the 50% gray level and sets all pixels below that value to black, and the rest to white. | ||
Let us examine in detail what happens to the image when we do this. | Let us examine in detail what happens to the image when we do this. | ||
Below are two images taken with the same camera at different times. Notice that the demarcation between the light | Below are two images taken with the same camera at different times. Notice that the demarcation between the light and dark areas is diffuse. This isn't an error in focusing the camera. It is a consequence of modern digital photography, which purposely blurs out a boundary like this using a scheme known as "anti-aliasing." This creates a boundary that appeals to the viewer's eye without the jagged steps that the individual pixels make with one another. Unfortunately this scheme imposes a loss of accuracy that we must seek to regain when we use a consumer camera as a measuring instrument instead of an artistic tool. | ||
More sophisticated image processing applications such as Adobe Photoshop or Inkscape allow you to set a threshold at some other value besides the exact middle, and the following discussion will show why this is desirable. | More sophisticated image processing applications such as Adobe Photoshop or Inkscape allow you to set a threshold at some other value besides the exact middle, and the following discussion will show why this is desirable. | ||
A detail of the original images are displayed below, left. Next to each there is a histogram of the pixel values in the image, captured using Adobe Photoshop. | A detail of the original images are displayed below, left. Next to each there is a histogram of the pixel values in the image, captured using Adobe Photoshop. | ||
The first image is a detail from the previous illustration, shot with a white paper background. | |||
[[File:Tut5_re-rev-eng_bracket_pic_blowup_2_.png|350px|blowup in color]] | [[File:Tut5_re-rev-eng_bracket_pic_blowup_2_.png|350px|blowup in color]] | ||
| Line 48: | Line 52: | ||
[[File:Tut5_re-rev-eng_bracket_pic_blowup_bad_cont_histogram_labeled_.png|345px|bad blowup histo]] | [[File:Tut5_re-rev-eng_bracket_pic_blowup_bad_cont_histogram_labeled_.png|345px|bad blowup histo]] | ||
A comparison of the two images shows that the dark portion is about the same value while the backgrounds have different values. The histograms for both images show two peaks (a "bimodal" distribution) with little or no overlap, where the curve to the left indicates the values in the dark part of the image and the curve to the right indicates the values in the light part of the image. | A comparison of the two images shows that the dark portion is about the same value (or gray-level) while the backgrounds have different values. The histograms for both images show two peaks (a "bimodal" distribution) with little or no overlap, where the curve to the left indicates the values in the dark part of the image and the curve to the right indicates the values in the light part of the image. | ||
Examine the histograms more closely. Notice that the curves in the graphs aren't sharply defined, but rather they have relatively long "tails" that extend in both directions away from the peaks. Notice also that in the first image, the threshold level (50% gray) falls in a relatively unpopulated region between the tails of the two peaks in the histogram. In the second image the threshold value falls upon part of the tail of the curve on the right, corresponding to the background. | Examine the histograms more closely. Notice that the curves in the graphs aren't sharply defined, but rather they have relatively long "tails" that extend in both directions away from the peaks. Notice also that in the first image, the threshold level (50% gray) falls in a relatively unpopulated region between the tails of the two peaks in the histogram. In the second image the threshold value falls upon part of the tail of the curve on the right, corresponding to the background. | ||
For the first image, the division between "black" and "white" areas is accurate. In the second image | For the first image, the division between "black" and "white" areas is accurate. In the second image points that should be in the "white" population will be erroneously assigned to color "black." The pixels in this population are all located within the boundary between the light and dark regions. The error causes the dark region of the image to bleed outward beyond the boundary where it ought to be confined, making the piece longer and the holes smaller. | ||
It should be obvious from this discussion that the best results are obtained by making the object as dark as possible and using a background that is as light as possible. | It should be obvious from this discussion that the best results are obtained by making the object as dark as possible and using a background that is as light as possible. | ||
| Line 92: | Line 96: | ||
A rendering of the selected image should appear in the window. In the previous section when we cropped the image we measured the width of the field. For the "good" image this value was 14.5 inches. This value is used to scale the image in the toolbar across the top of the window. | A rendering of the selected image should appear in the window. In the previous section when we cropped the image we measured the width of the field. For the "good" image this value was 14.5 inches. This value is used to scale the image in the toolbar across the top of the window. | ||
To create an outline of the dark area, select the Accuscan tool along the left margin of the window. | To create an outline of the dark area, select the Accuscan tool along the left margin of the window as indicated below. | ||
[[File:TMCAD_20241204_cap5_labeled.png|center|700px|Accuscan with labels]] | [[File:TMCAD_20241204_cap5_labeled.png|center|700px|Accuscan with labels]] | ||
| Line 100: | Line 104: | ||
[[File:TMCAD_20241204_cap6_labeled.png|center|700px|Accuscan settings]] | [[File:TMCAD_20241204_cap6_labeled.png|center|700px|Accuscan settings]] | ||
To complete the process of converting the image to an outline for the tool path, click on the | To complete the process of converting the image to an outline for the tool path, click on the button on the tool bar as indicated below. Other tools on this bar aren't relevant here. | ||
[[File:TMCAD_20241204_cap7_labeled.png|center|700px|Vectorize button]] | [[File:TMCAD_20241204_cap7_labeled.png|center|700px|Vectorize button]] | ||
This exits the Accuscan mode in the program and shows the calculated outline. When selected, the outline becomes red. For this image, please note that the overall length displayed in the toolbar has changed. Now it displays the overall length of the outline, which is 12.609 inches, or about 0.051 inches smaller than the original. | This exits the Accuscan mode in the program and shows the calculated outline. When selected, the outline becomes red. For this image, please note that the overall length displayed in the toolbar has changed. Now it displays the overall length of the outline, which is 12.609 inches, or about 0.051 inches smaller than the original. This error amounts to slightly less than two pixels, where a pixel is 1/35.45 inches, or 0.028 inches. | ||
[[File:TMCAD_20241204_cap8_labeled.png|center|700px|Vector outline]] | [[File:TMCAD_20241204_cap8_labeled.png|center|700px|Vector outline]] | ||
If we perform the same operation on the "bad" image with the darker background, the resulting length of the part becomes 12. | If we perform the same operation on the "bad" image with the darker background, the resulting length of the part becomes 12.790 inches, or 0.130 inches (4.6 pixels) larger than the original. | ||
[[File:TMCAD_20241217_cap07_labeled.png|center|700px|Vector outline]] | |||
Students of information theory may recall the "Nyquist" limit for sampling a signal. This limit expresses the resolution of a sampled function based on the sampling rate, and it corresponds to about two times the period of sampling. By careful staging of the digital photography we have achieved this limit with a minimum of software manipulation. The second image can be made more accurate, but only through additional processing e.g. with Photoshop or Inkscape. | Students of information theory may recall the "Nyquist" limit for sampling a signal. This limit expresses the resolution of a sampled function based on the sampling rate, and it corresponds to about two times the period of sampling. By careful staging of the digital photography we have achieved this limit with a minimum of software manipulation. The second image can be made more accurate, but only through additional processing e.g. with Photoshop or Inkscape. | ||
| Line 130: | Line 136: | ||
For the image shot with a gray background, the dimensional error is too large to fix by scaling. If you have access to a relatively sophisticated image-processing tool (not Paint) then you can adjust the threshold level to the B-W conversion of the image to some value besides 50% gray (this is equal to 127 in the digital value.) | For the image shot with a gray background, the dimensional error is too large to fix by scaling. If you have access to a relatively sophisticated image-processing tool (not Paint) then you can adjust the threshold level to the B-W conversion of the image to some value besides 50% gray (this is equal to 127 in the digital value.) | ||
For the image with the gray background we find that setting the threshold to | For the image with the gray background we find that setting the threshold to 84 instead of 127 gives better results. In this case the part is rendered at 12.722 inches in length. We can be confident that the holes are also the right size and in the right locations with this method. | ||
In Photoshop this process is quite straightforward: Open the image for editing, select the whole area (CTRL-A) and select the "Levels" tool (CTRL-L). The display will show the histogram as illustrated at the top of this document, and you can drag the white and black arrows to an area between the two peaks that is relatively unpopulated, and place them close together. Save the file as .JPG or .PNG. | In Photoshop this process is quite straightforward: Open the image for editing, select the whole area (CTRL-A) and select the "Levels" tool (CTRL-L). The display will show the histogram as illustrated at the top of this document, and you can drag the white and black arrows to an area between the two peaks that is relatively unpopulated, and place them close together. Save the file as .JPG or .PNG. | ||
| Line 136: | Line 142: | ||
In Inkscape the process is also pretty straightforward. Import the image and select the "Trace Bitmap" tab. This will give you a slider with which to adjust the threshold level up and down. In the image below, the threshold has been placed just at the point where some of the black areas start to appear white. The level is given as 0.33, which corresponds to a digital value of 84. Click the "Apply" button. Then you will need to select the background, which is the original image, and delete it. Then export the image either as .JPG or as .PNG. | In Inkscape the process is also pretty straightforward. Import the image and select the "Trace Bitmap" tab. This will give you a slider with which to adjust the threshold level up and down. In the image below, the threshold has been placed just at the point where some of the black areas start to appear white. The level is given as 0.33, which corresponds to a digital value of 84. Click the "Apply" button. Then you will need to select the background, which is the original image, and delete it. Then export the image either as .JPG or as .PNG. | ||
[[File:Tut5_inkscape_threshold_capture_labeled.png|center| | [[File:Tut5_inkscape_threshold_capture_labeled.png|center|750px|inkscape screencap]] | ||
It is important here to point out | It is important here to point out subtle difference between the images shot with a white background and a gray background. In the figure below, details of the images show the slot that allows for a [[:Brackets_Tutorial_2b:_Fabricating_a_Bracket_from_a_Solidworks_Design#Bend_the_Sheet | corner to be bent.]] Part (a) had the white background and (b) and (c) had the gray background. Parts (a) and (b) had a threshold value of 127 (50% gray) while part (c) had a threshold of 84 (33% gray.) | ||
[[File:Tut5_slot_compare_.png|center|600px|wht vs gray bkgnd]] | |||
Notice | Notice that the slot is preserved only in the image shot with a white background. The effect of different threshold levels in the gray-background images is to preserve the integrity of the slot to different degrees. | ||
This error is very easy to correct. The image can be imported into "Paint" and the line color is selected to be white. A line can be drawn through the region of the slot to eliminate the gray pixels found there. | |||
==Apply Tool Compensation== | ==Apply Tool Compensation== | ||
There are two stages where the user can offset the tool path | There are two stages where the user can offset the tool path and compensate for the '''bleed''' effect in the original image. This has nearly the same effect as re-thresholding the image. If the tool path is displaced inwards the part becomes smaller, holes become larger, and they stay the same distance apart. | ||
Using Torchmate CAD, we will create a tool path in much the same fashion as shown in [[:Brackets_Tutorial_4:_Basic_Cardboard_Aided_Design#Create_a_Tool_Path | Tutorial 4]] | |||
In the normal course of processing Torchmate CAD applies an offset to the tool path to compensate for the width of the kerf cut by the torch. The setting in the program is 0.059 inches. If you select a "Male" tool path, the cut is displaced outwards by the set thickness. If you choose "Female" the cut is displaced inwards. If you select "Online" the tool path has no displacement applied to it. | |||
Without repeating too much of what was covered in the previous tutorial, we first examine the image taken with a gray background and scanned in Inkscape with a B/W threshold of 84/256. The resulting outline (not yet a tool path) is shown below. | |||
[[File:Tut5_re-rev-eng_gray_bkgnd_84_TMCAD_labeled.png|center|600px|gray 84 scanned]] | |||
Notice the value given for the length: 12.722. This is over-size by 0.062. Fortuitously the kerf-width of the CNC plasma cutter is between 0.06 and 0.08. Therefore we can simply convert this image to a tool path with no tool width compensation and expect the part to come out the right dimension. | |||
To do this, we pull down Arrange::Make Path; followed by Machine::Create Tool Path::Online; and export as DXF. Next we import the DXF file into the Torchmate driver software and convert it to FGC (G-Code) with no tool offset. | |||
[[File:Tut5_re-rev-eng_gray_bkgnd_84_TM4_data.png|center|600px|gray 84 in TM4]] | |||
The driver software doesn't give us a display of the overall dimensions of the tool path but we can find the maximum X-coordinate (highlighted) in the G-Code listing. Note that it is still equal to 12.722 (the minimum X being equal to zero.) | |||
The image with a white background is scanned to a contour with overall length 12.609 inches. We need to make it larger than this, so we can convert it to a "Male" tool path which adds 0.059 inches to its length. We then incorporate it into the Torchmate driver software. If we interrogate the data with no additional tool offset, we find the span to be 12.667. Therefore, we shall re-import the DXF file into the Torchmate driver with a tool offset of 0.06 inches to the outside of the path. This is done by selecting Tool #6, with the pull-down menu saying "Outside." The overall length of the path is found to become 12.727 inches. | |||
Finally, we can process the worst of the set of images. The overall length of the contour is 12.790. We export it as an "Online" tool path and then import it into the Torchmate driver with Tool #6 with the pulldown option set to "Inside." When this is done and we interrogate the data we find the path has an overall length of 12.728 inches. | |||
The two stages of tool compensation withing the Torchmate utilities are more than enough to correct the size of different scans of the part. | |||
=Conclusion= | |||
We have shown that by photographing a flat pattern on a camera stand, we can render parts larger than those that can be scanned on a flatbed scanner. Using the method outlined above there is ample opportunity to measure any errors in linear dimension and to correct them in process. Scanning errors in the details can be corrected when the data is in the form of a bitmap, using as utility program as basic as "Paint." | |||
Having created an accurate DXF file in this tutorial, the example part can be cut, bent and finished using the method outlined in [[:Brackets_Tutorial_2b:_Fabricating_a_Bracket_from_a_Solidworks_Design#Import_DXF_into_Torchmate | Solidworks Tutorial 2b]]. | |||
Latest revision as of 13:51, 19 December 2024
Link to: Bracketage Main Page
Introduction
This tutorial was written during the Great Solidworks Blackout between Oct and Dec 2024. If you want to study Solidworks, please view the Solidworks tutorials elsewhere.
This tutorial covers a photographic technique for gathering data from an existing part. As an example, we use one of the sheet-metal blanks from Tutorial 2b. Digital photography straddles the digital and analog domains. We will show how to gain the best precision from using the software tools to convert a photo into a CNC program.
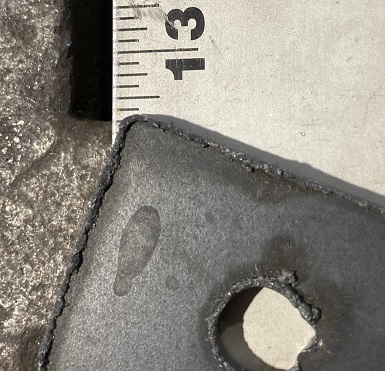
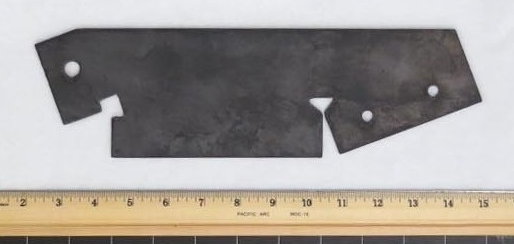
To track the precision of the process, we will use the length of the bracket as an indicator. The photograph below shows that the bracket is 12.66 inches long.
Photography
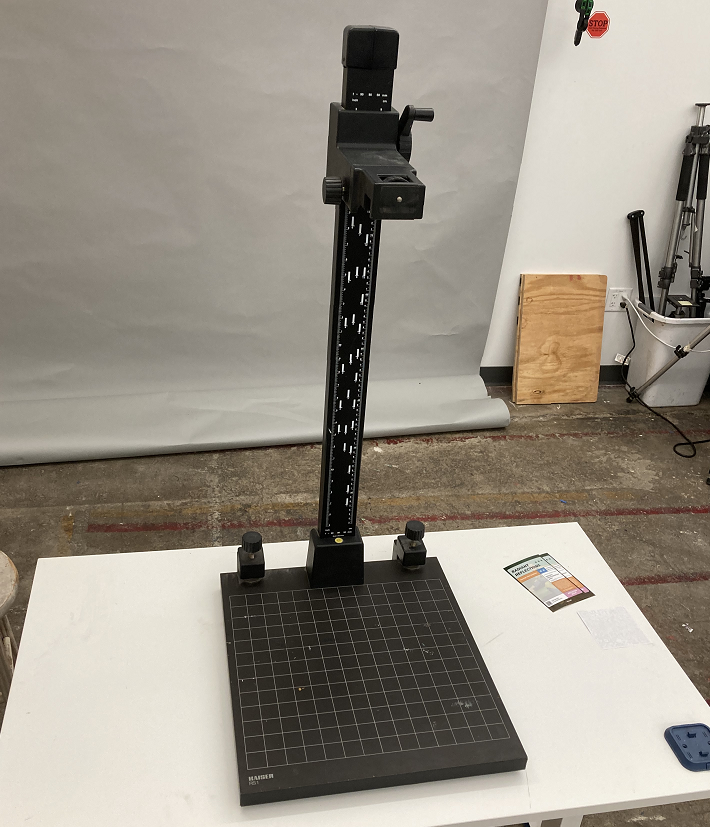
A good quality camera stand (Kaiser RS-1) can be found in the Photo/Design shop at Artisans Asylum. With the camera mount moved all of the way to the top, the field of view with an ordinary camera is about 40 inches (1 meter) wide and about half that in height.
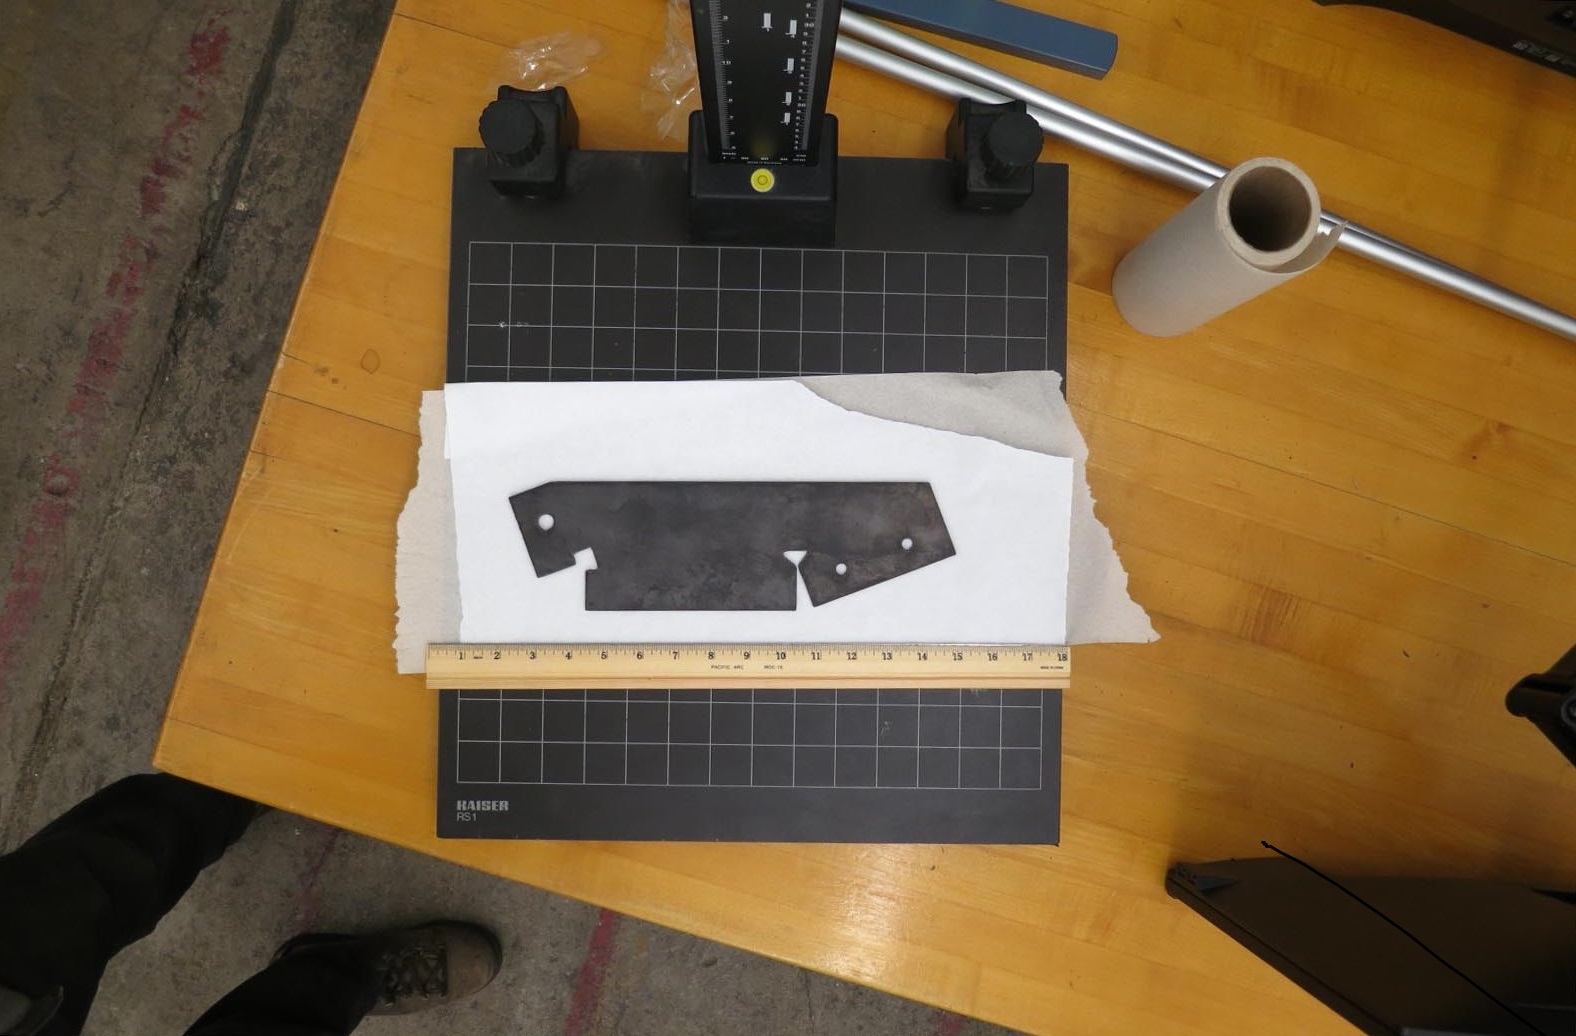
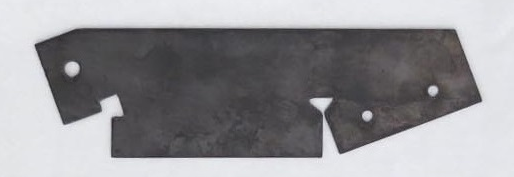
A dark, unfinished steel bracket blank from Tutorial 2b has been placed on a white paper background and photographed with an undistinguished digital camera. Some care has been taken to avoid the presence of shadows inside the slot in the lower right of the blank, which is about 1/8 inch thick.
The resolution of the image is 35.44 dpi, or 0.717 mm per pixel. This calculation can be done in a variety of ways. The most immediately available method is to photograph a ruler along with the pattern, as shown. By counting the pixels between the ends of the ruler, the resolution can be found. A pixel count can be obtained using the "Paint" application, which displays the numerical cursor location in the lower-left corner of the window. The 18-inch ruler in the image is 638 pixels long: 638/18 = 35.44 dpi. This resolution calculation is for illustration only. It's not needed for the process described here.
Image Analysis
As in the previous tutorial, we need to convert the image into a high-contrast black-and-white bitmap. Tutorial 4 showed how to use "Paint" in an unsophisticated approach with few options. The application sets up a threshold at the 50% gray level and sets all pixels below that value to black, and the rest to white.
Let us examine in detail what happens to the image when we do this.
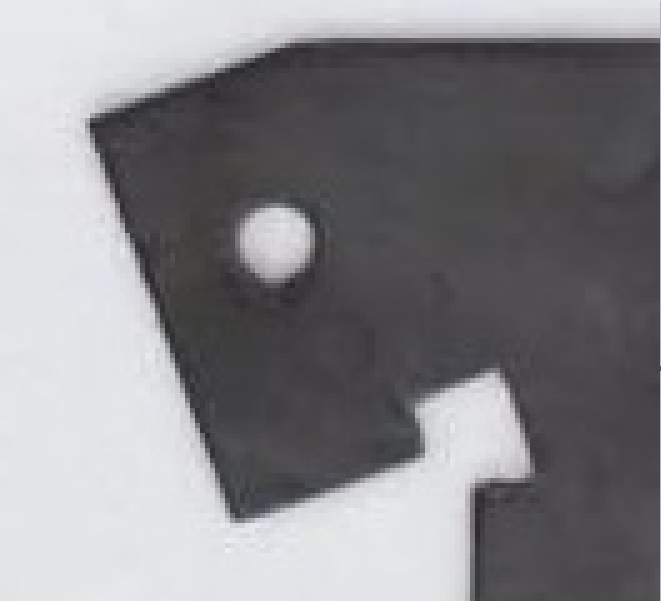
Below are two images taken with the same camera at different times. Notice that the demarcation between the light and dark areas is diffuse. This isn't an error in focusing the camera. It is a consequence of modern digital photography, which purposely blurs out a boundary like this using a scheme known as "anti-aliasing." This creates a boundary that appeals to the viewer's eye without the jagged steps that the individual pixels make with one another. Unfortunately this scheme imposes a loss of accuracy that we must seek to regain when we use a consumer camera as a measuring instrument instead of an artistic tool.
More sophisticated image processing applications such as Adobe Photoshop or Inkscape allow you to set a threshold at some other value besides the exact middle, and the following discussion will show why this is desirable.
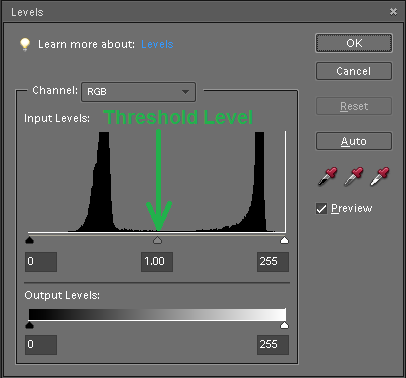
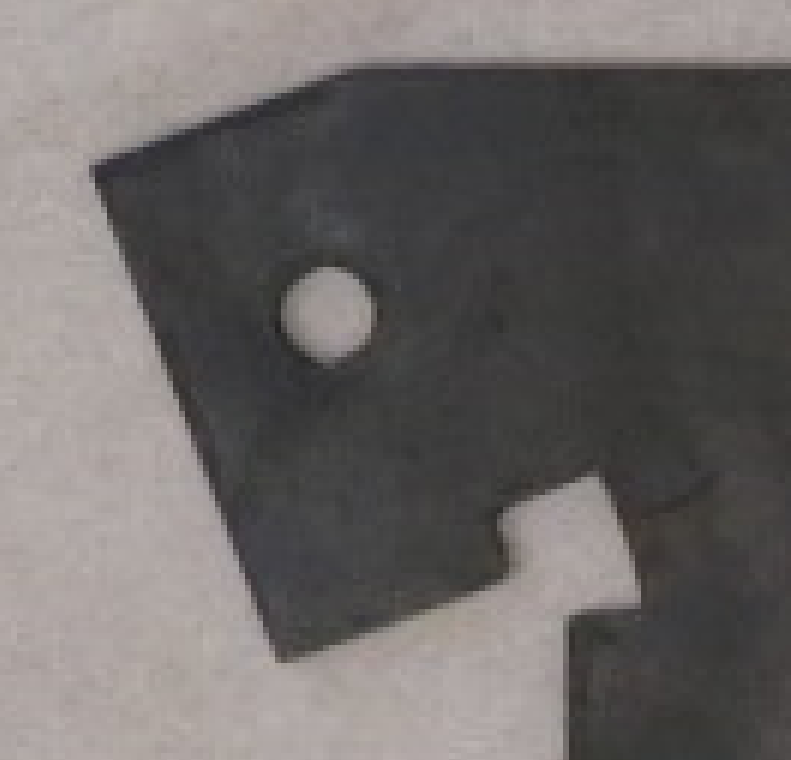
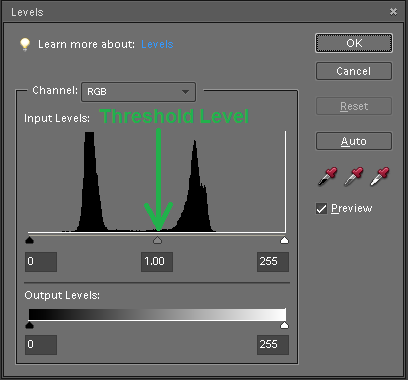
A detail of the original images are displayed below, left. Next to each there is a histogram of the pixel values in the image, captured using Adobe Photoshop.
The first image is a detail from the previous illustration, shot with a white paper background.
On another occasion the same piece was photographed with the same camera in lower light, and using a grayish paper towel as a background instead of a piece of white paper.
A comparison of the two images shows that the dark portion is about the same value (or gray-level) while the backgrounds have different values. The histograms for both images show two peaks (a "bimodal" distribution) with little or no overlap, where the curve to the left indicates the values in the dark part of the image and the curve to the right indicates the values in the light part of the image.
Examine the histograms more closely. Notice that the curves in the graphs aren't sharply defined, but rather they have relatively long "tails" that extend in both directions away from the peaks. Notice also that in the first image, the threshold level (50% gray) falls in a relatively unpopulated region between the tails of the two peaks in the histogram. In the second image the threshold value falls upon part of the tail of the curve on the right, corresponding to the background.
For the first image, the division between "black" and "white" areas is accurate. In the second image points that should be in the "white" population will be erroneously assigned to color "black." The pixels in this population are all located within the boundary between the light and dark regions. The error causes the dark region of the image to bleed outward beyond the boundary where it ought to be confined, making the piece longer and the holes smaller.
It should be obvious from this discussion that the best results are obtained by making the object as dark as possible and using a background that is as light as possible.
Monochrome Bitmap
The image below is a rendering of the first ("good") image that has been saved as a monochrome bitmap as in Tutorial 4. The corresponding rendering from the second ("bad") image isn't shown because the two are almost indistinguishable.
Please note that the images we are considering were photographed at relatively low resolution, between 35 and 36 dots per inch. The resolution could be improved by moving the camera closer to the object, reducing the width of the field of view. A camera with a higher pixel density would accomplish the same goal.
Notice the jagged outline of potions of the image. This effect is known as "aliasing." Consumer-quality digital cameras apply an algorithm ("anti-aliasing") to the images to smooth out the effect and make the image more pleasing to the eye. The operation of converting to a monochrome bitmap has re-aliased the image, reversing the effect of the algorithm.
Crop the Image
To preserve the scale of the data in the image, we will crop it in two steps. Ultimately we will eliminate all of the features in the image that are neither background nor the pattern of interest. To preserve the scale, we first crop the image as shown in the picture below left, keeping the ruler in the image temporarily.
We can inspect the ruler in the cropped image and find that the field is 14-1/2 inches wide. As a check we can look in the "Properties" window for the file and find the cropped image is 514 pixels wide. The quantity 514/14.5 = 35.45 dpi. This coincides with the earlier calculation of the resolution from the whole image, except for a small round-off error.
Having found the width of the field we crop the image a second time, keeping the width constant but eliminating the ruler from the bottom margin of the image. This is the file that we will import into Torchmate CAD that, like "Paint," sets a threshold to 50% gray when vectorizing.
Vectorization of the Bitmap
To transform the bitmap data into a tool path for the CNC plasma cutter, we import each cropped image into Torchmate CAD in the same fashion as in Tutorial 4. Click on the icon ![]() to open a blank page. Pull down the "Import" item from the "File" menu.
to open a blank page. Pull down the "Import" item from the "File" menu.
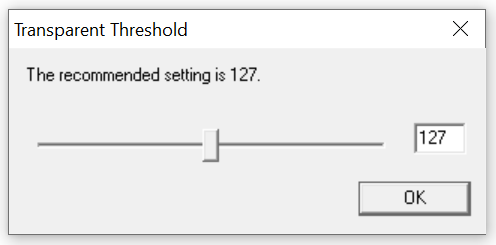
After picking the desired image file, a box will appear that seems to allow the user to select a threshold value for the B/W conversion. Don't get your hopes up. Changing the value here has no effect.
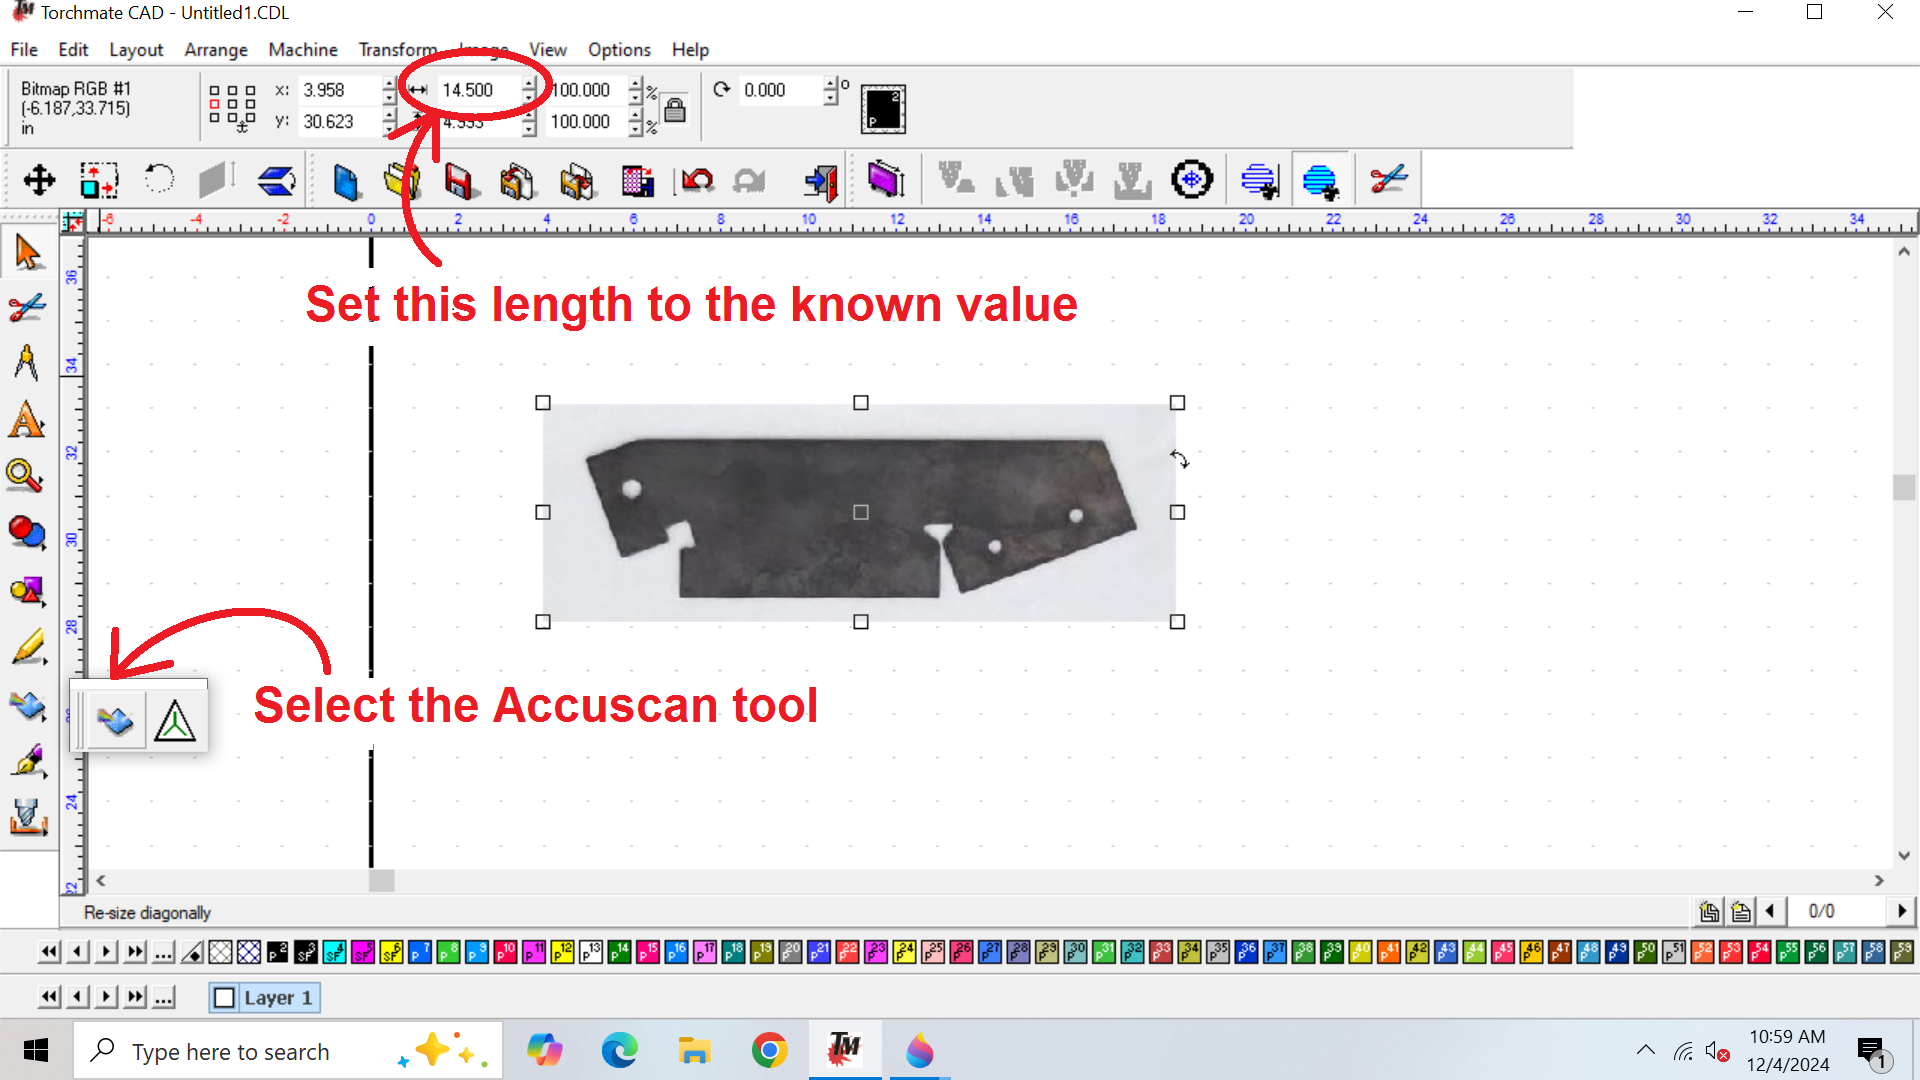
A rendering of the selected image should appear in the window. In the previous section when we cropped the image we measured the width of the field. For the "good" image this value was 14.5 inches. This value is used to scale the image in the toolbar across the top of the window.
To create an outline of the dark area, select the Accuscan tool along the left margin of the window as indicated below.
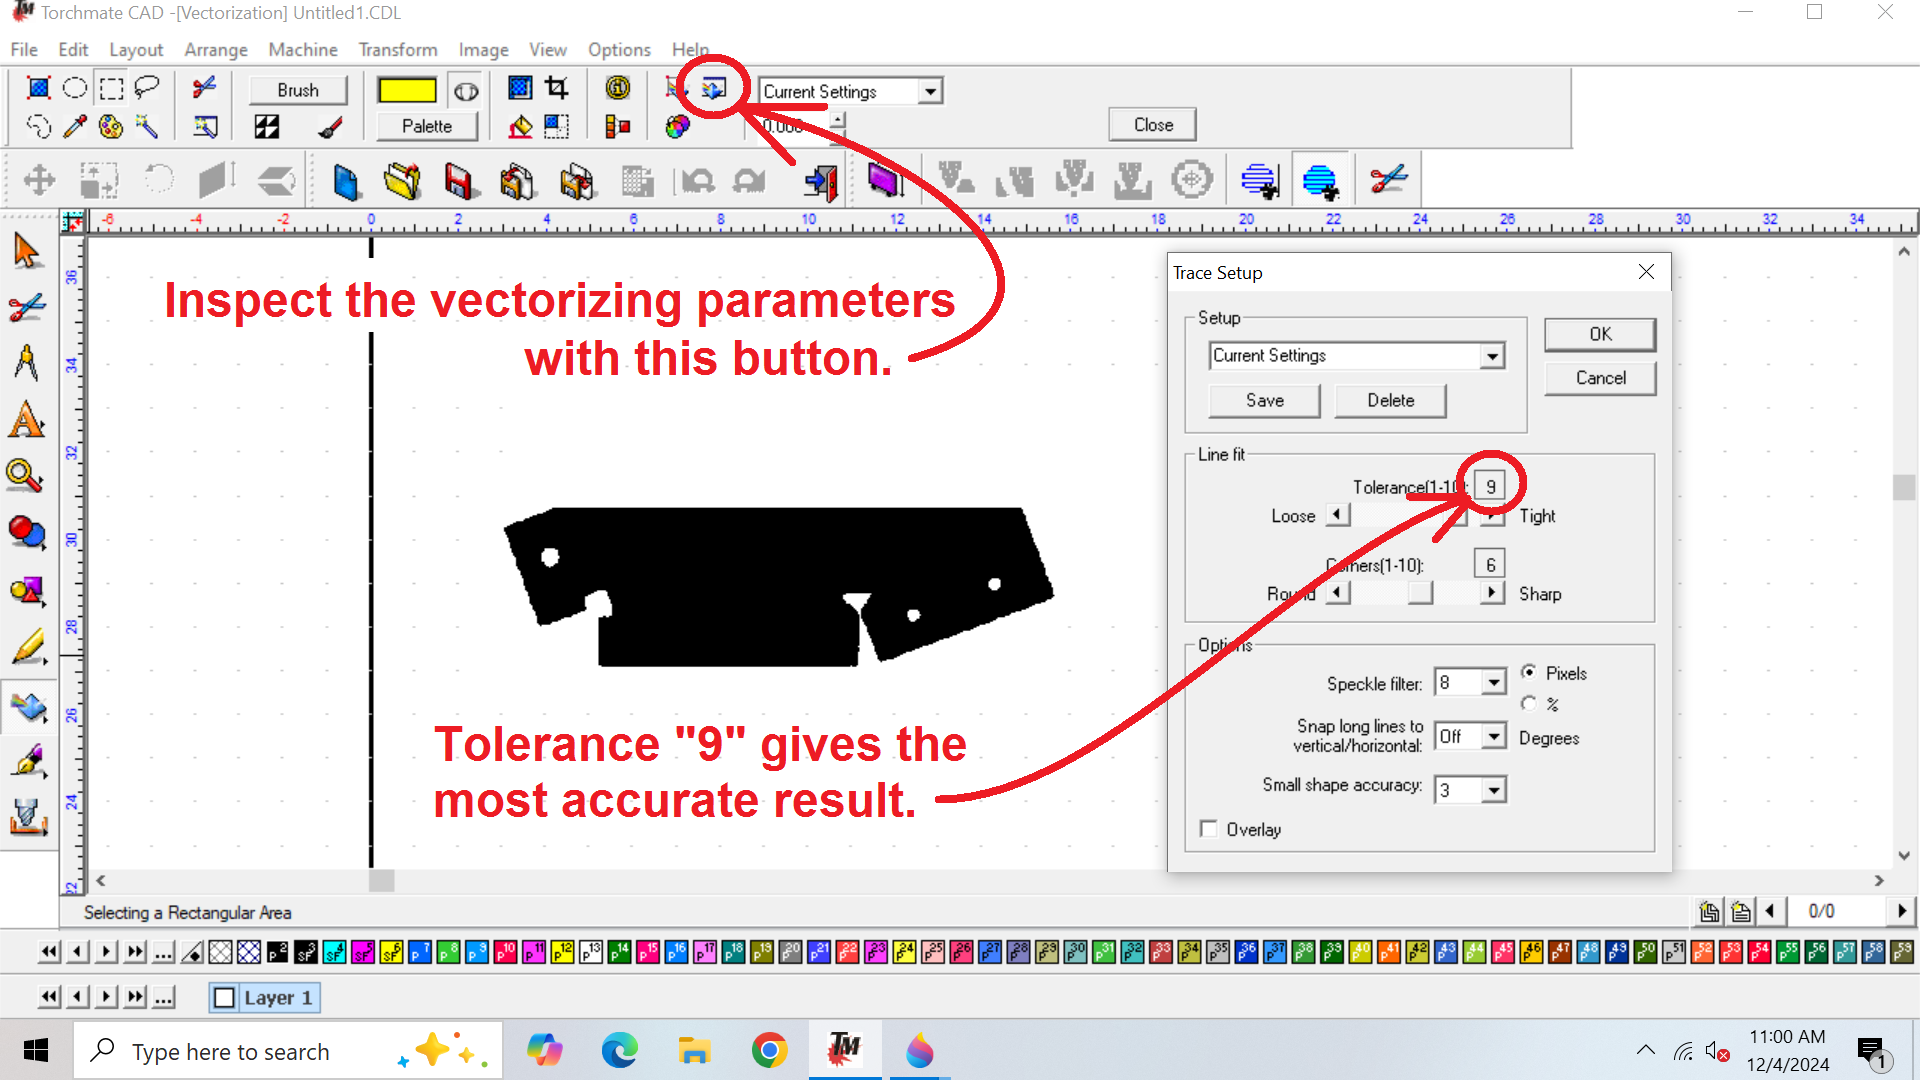
Check the settings with the small button indicated on the tool bar. The "Tolerance" setting must be relatively high for an accurate conversion, however the highest setting incorporates the re-aliased jaggies into the tool path.
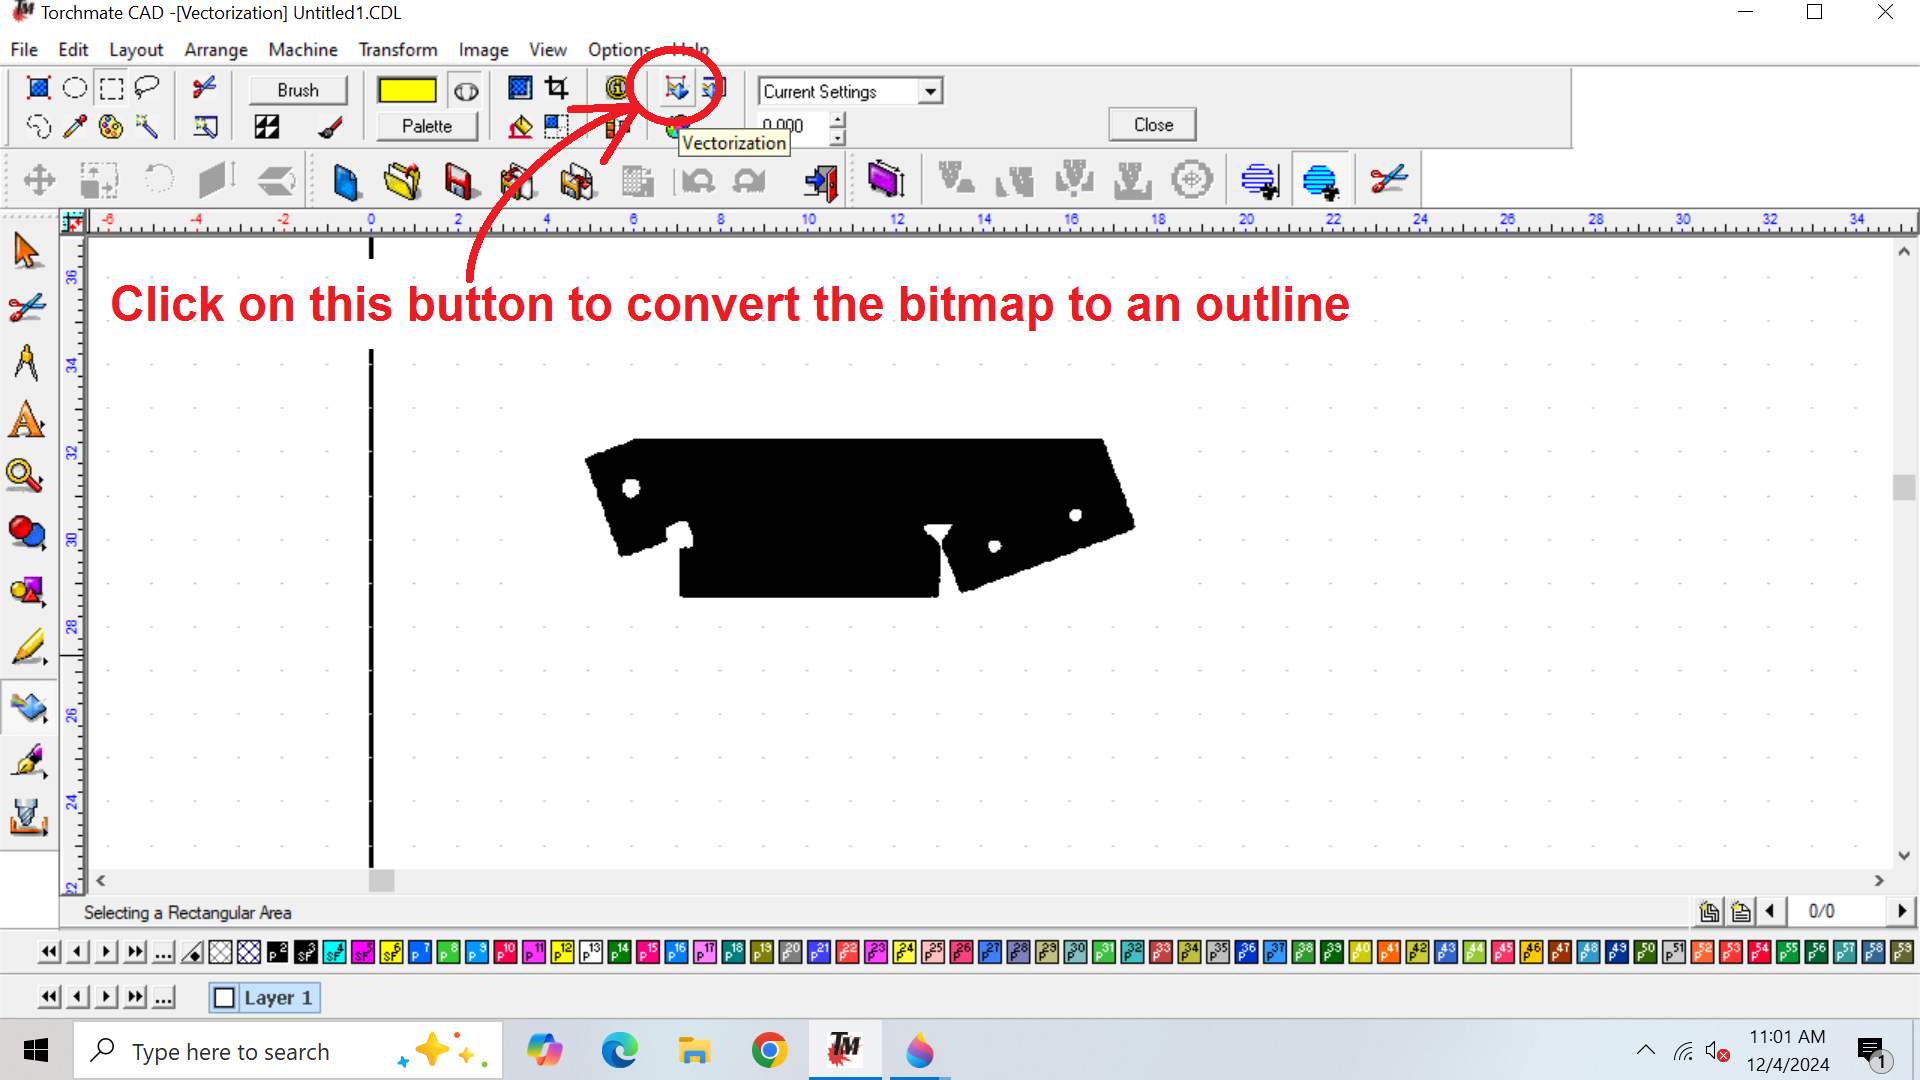
To complete the process of converting the image to an outline for the tool path, click on the button on the tool bar as indicated below. Other tools on this bar aren't relevant here.
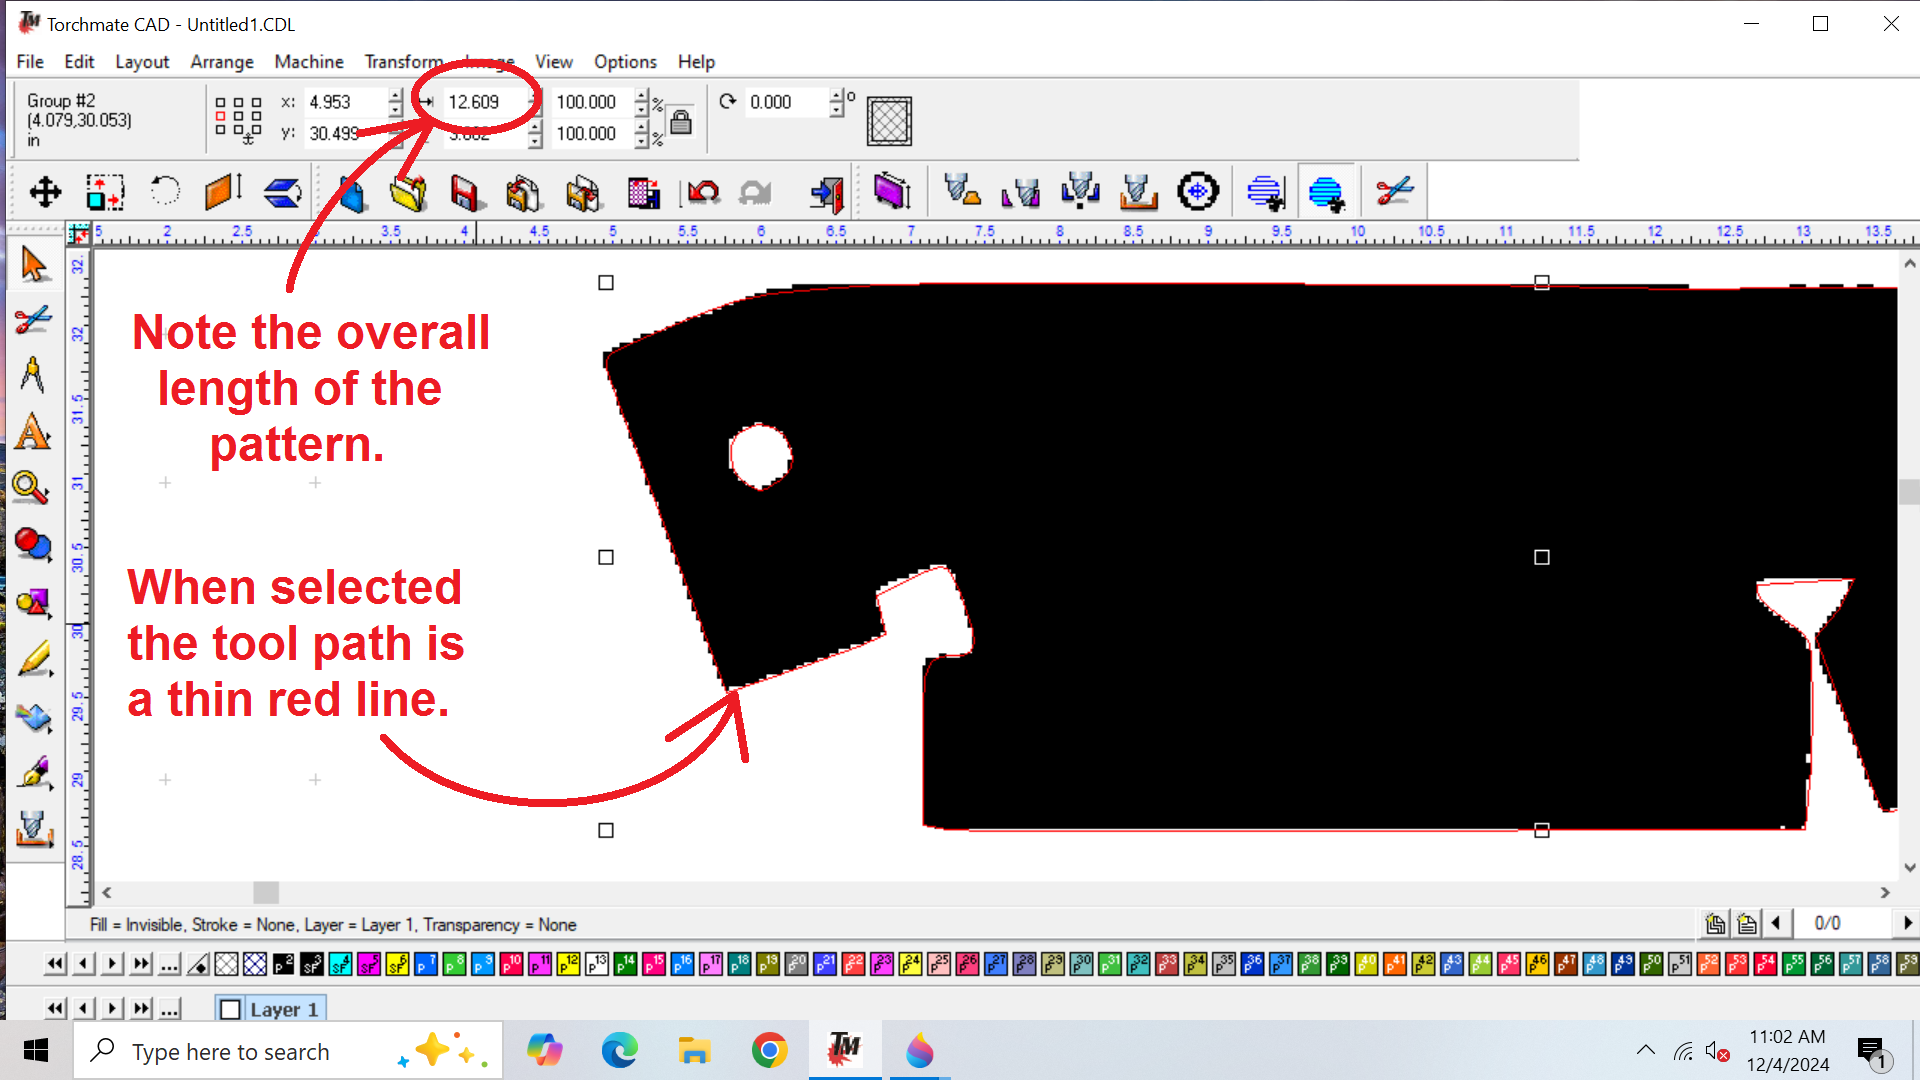
This exits the Accuscan mode in the program and shows the calculated outline. When selected, the outline becomes red. For this image, please note that the overall length displayed in the toolbar has changed. Now it displays the overall length of the outline, which is 12.609 inches, or about 0.051 inches smaller than the original. This error amounts to slightly less than two pixels, where a pixel is 1/35.45 inches, or 0.028 inches.
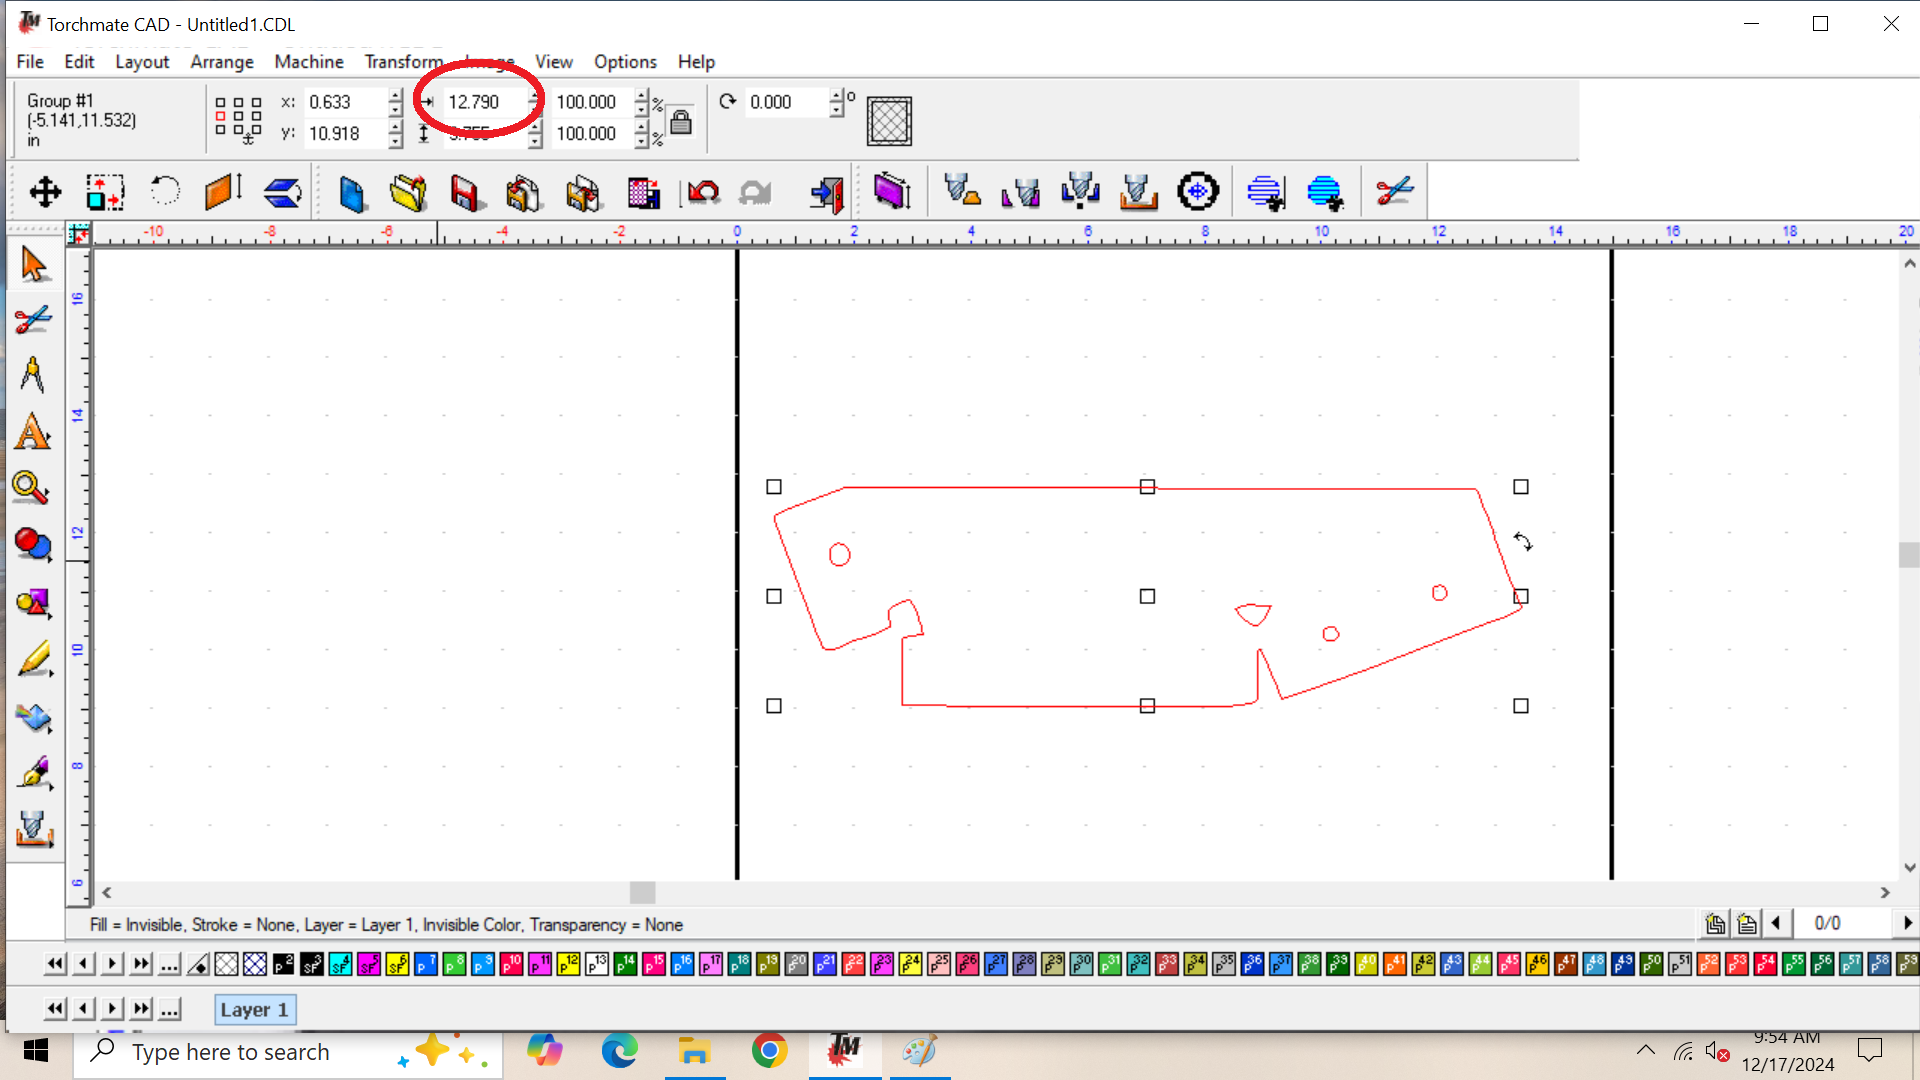
If we perform the same operation on the "bad" image with the darker background, the resulting length of the part becomes 12.790 inches, or 0.130 inches (4.6 pixels) larger than the original.
Students of information theory may recall the "Nyquist" limit for sampling a signal. This limit expresses the resolution of a sampled function based on the sampling rate, and it corresponds to about two times the period of sampling. By careful staging of the digital photography we have achieved this limit with a minimum of software manipulation. The second image can be made more accurate, but only through additional processing e.g. with Photoshop or Inkscape.
Alternate paths to Accuracy
We're not done yet!! There are different ways to act on the information we just gathered. That is: We know how big the part is supposed to be and how big the scanned bitmap resolved in the software.
Scale the Part
By far the easiest way to correct the length of the part is to type in the correct dimension into the box circled in the previous illustration. This will change the scale of the part and make its length what you specify.
If the change is small, such as what we found in the first image example, then this should produce acceptable results. For the best accuracy, this method causes a problem.
When you scale a part, all of the features change in size by the amount you specify. If you make the part larger, the holes in the part also get larger and they get further apart.
This is different from the bleed effect produced by anti-aliasing the image. With this algorithm, the part gets larger but the holes get smaller and they stay the same distance apart (center-to-center.)
Re-Threshold the Image
For the image shot with a gray background, the dimensional error is too large to fix by scaling. If you have access to a relatively sophisticated image-processing tool (not Paint) then you can adjust the threshold level to the B-W conversion of the image to some value besides 50% gray (this is equal to 127 in the digital value.)
For the image with the gray background we find that setting the threshold to 84 instead of 127 gives better results. In this case the part is rendered at 12.722 inches in length. We can be confident that the holes are also the right size and in the right locations with this method.
In Photoshop this process is quite straightforward: Open the image for editing, select the whole area (CTRL-A) and select the "Levels" tool (CTRL-L). The display will show the histogram as illustrated at the top of this document, and you can drag the white and black arrows to an area between the two peaks that is relatively unpopulated, and place them close together. Save the file as .JPG or .PNG.
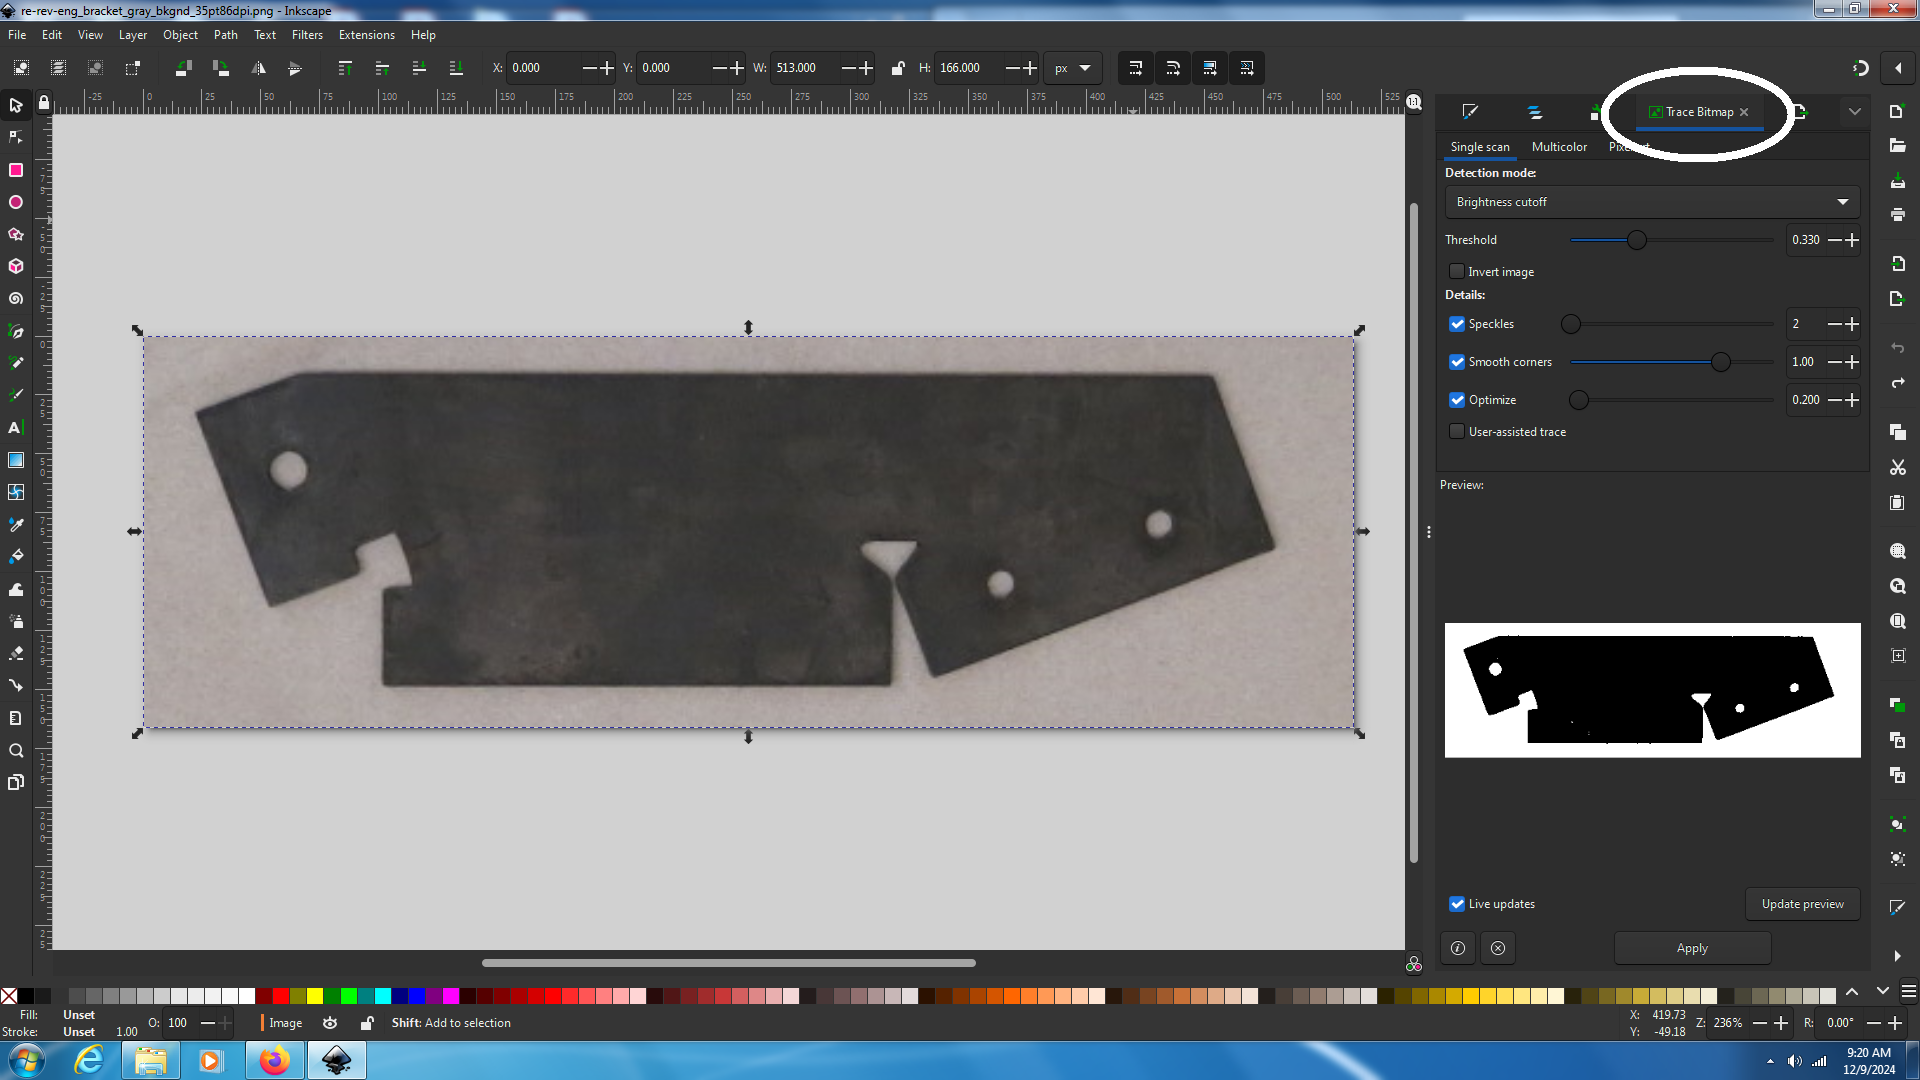
In Inkscape the process is also pretty straightforward. Import the image and select the "Trace Bitmap" tab. This will give you a slider with which to adjust the threshold level up and down. In the image below, the threshold has been placed just at the point where some of the black areas start to appear white. The level is given as 0.33, which corresponds to a digital value of 84. Click the "Apply" button. Then you will need to select the background, which is the original image, and delete it. Then export the image either as .JPG or as .PNG.
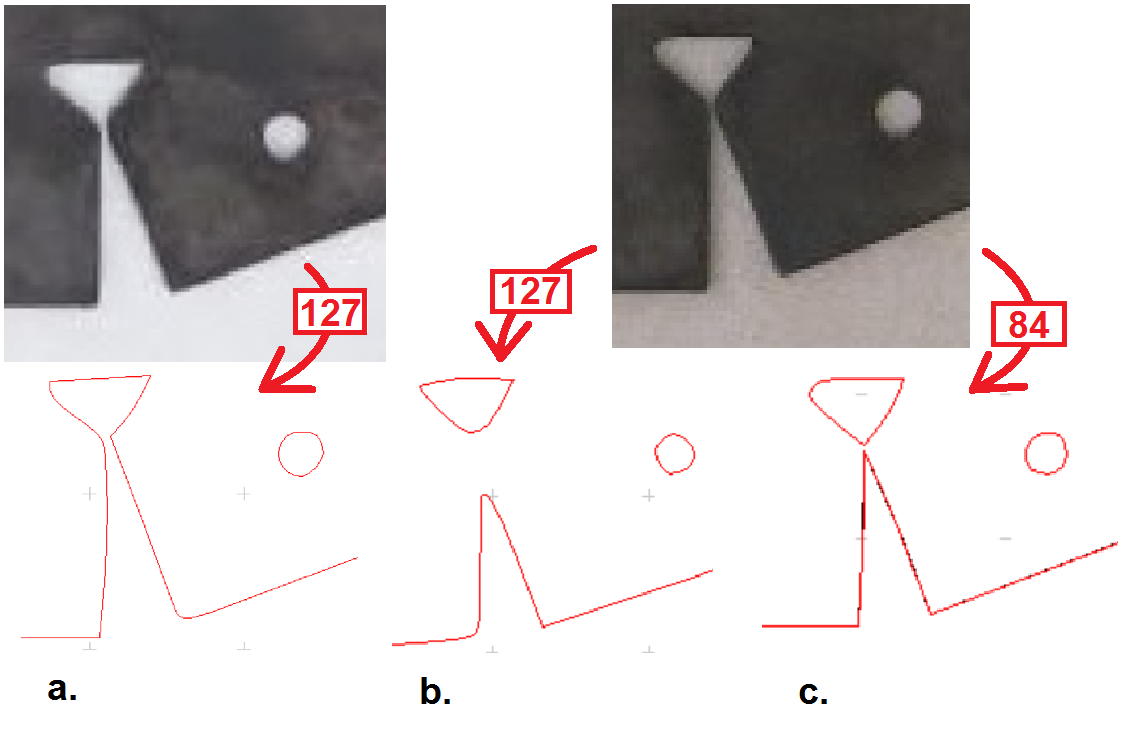
It is important here to point out subtle difference between the images shot with a white background and a gray background. In the figure below, details of the images show the slot that allows for a corner to be bent. Part (a) had the white background and (b) and (c) had the gray background. Parts (a) and (b) had a threshold value of 127 (50% gray) while part (c) had a threshold of 84 (33% gray.)
Notice that the slot is preserved only in the image shot with a white background. The effect of different threshold levels in the gray-background images is to preserve the integrity of the slot to different degrees.
This error is very easy to correct. The image can be imported into "Paint" and the line color is selected to be white. A line can be drawn through the region of the slot to eliminate the gray pixels found there.
Apply Tool Compensation
There are two stages where the user can offset the tool path and compensate for the bleed effect in the original image. This has nearly the same effect as re-thresholding the image. If the tool path is displaced inwards the part becomes smaller, holes become larger, and they stay the same distance apart.
Using Torchmate CAD, we will create a tool path in much the same fashion as shown in Tutorial 4
In the normal course of processing Torchmate CAD applies an offset to the tool path to compensate for the width of the kerf cut by the torch. The setting in the program is 0.059 inches. If you select a "Male" tool path, the cut is displaced outwards by the set thickness. If you choose "Female" the cut is displaced inwards. If you select "Online" the tool path has no displacement applied to it.
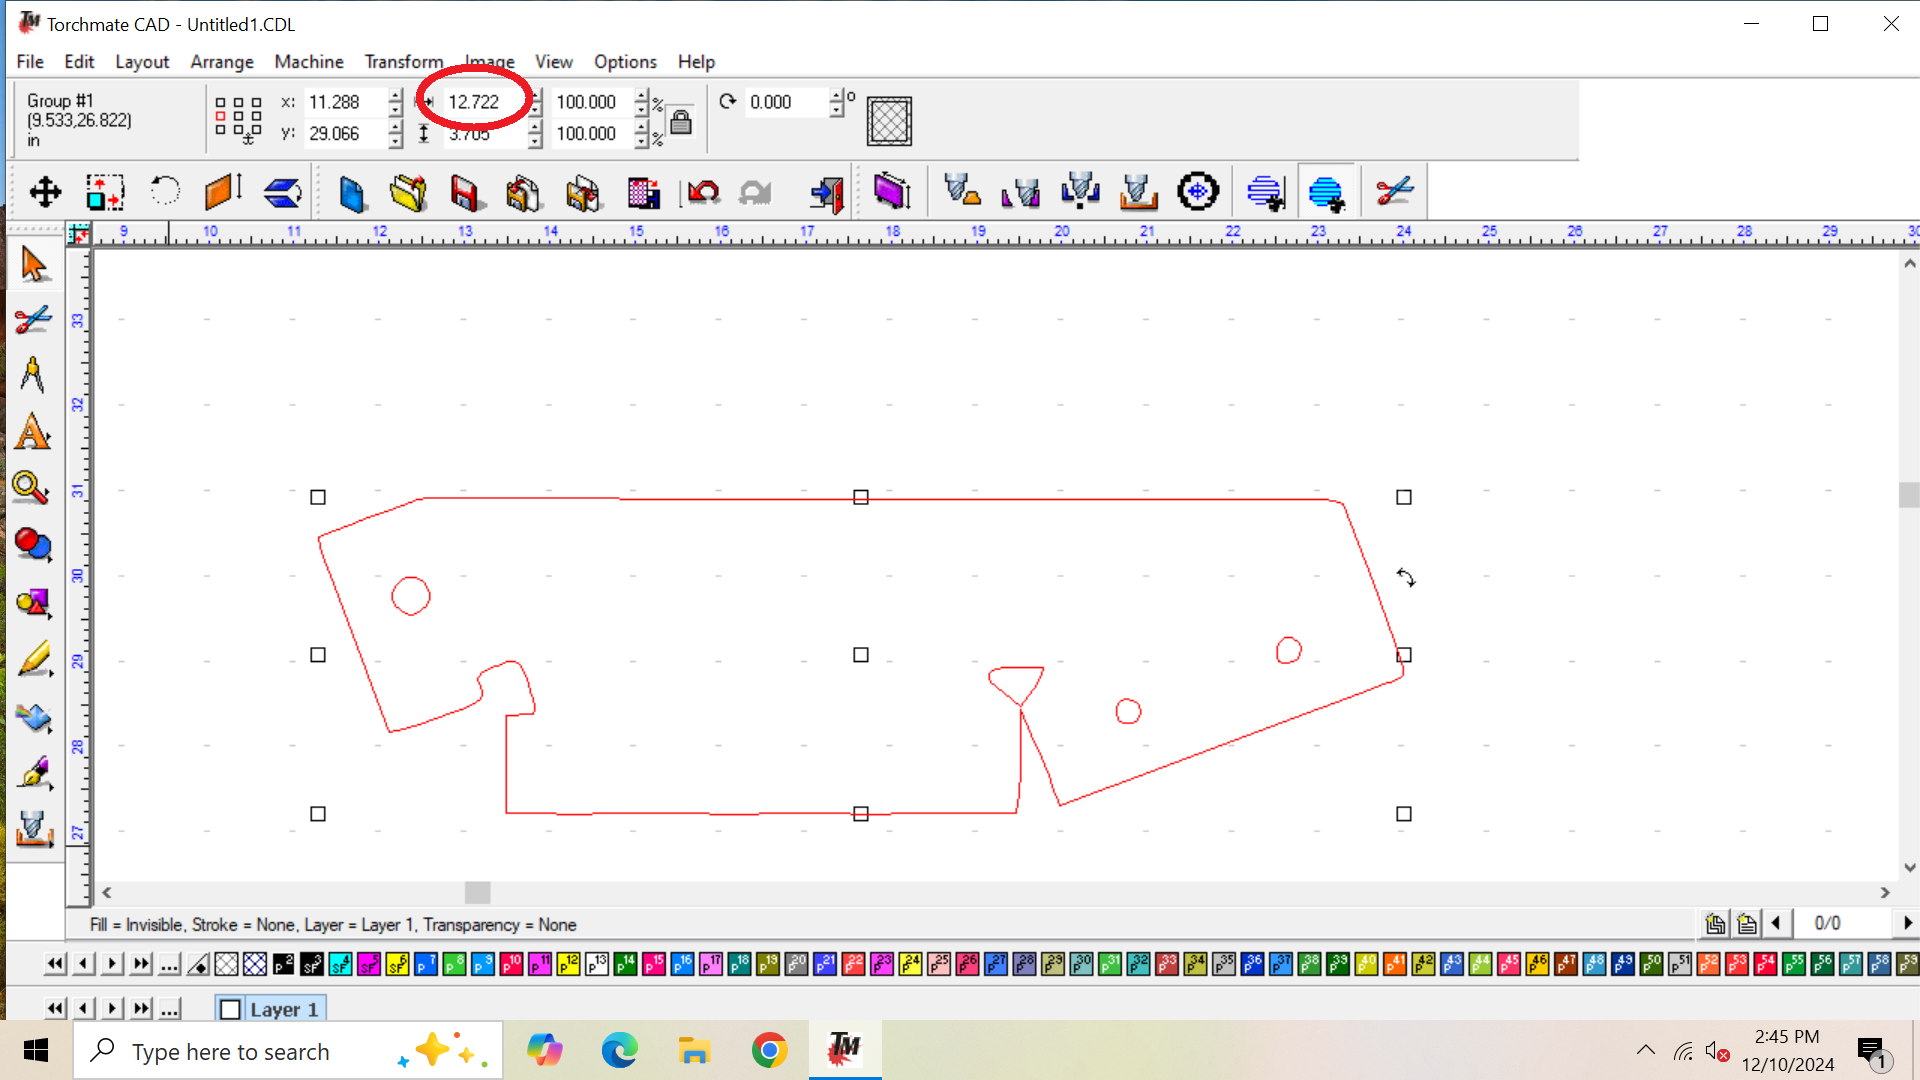
Without repeating too much of what was covered in the previous tutorial, we first examine the image taken with a gray background and scanned in Inkscape with a B/W threshold of 84/256. The resulting outline (not yet a tool path) is shown below.
Notice the value given for the length: 12.722. This is over-size by 0.062. Fortuitously the kerf-width of the CNC plasma cutter is between 0.06 and 0.08. Therefore we can simply convert this image to a tool path with no tool width compensation and expect the part to come out the right dimension.
To do this, we pull down Arrange::Make Path; followed by Machine::Create Tool Path::Online; and export as DXF. Next we import the DXF file into the Torchmate driver software and convert it to FGC (G-Code) with no tool offset.
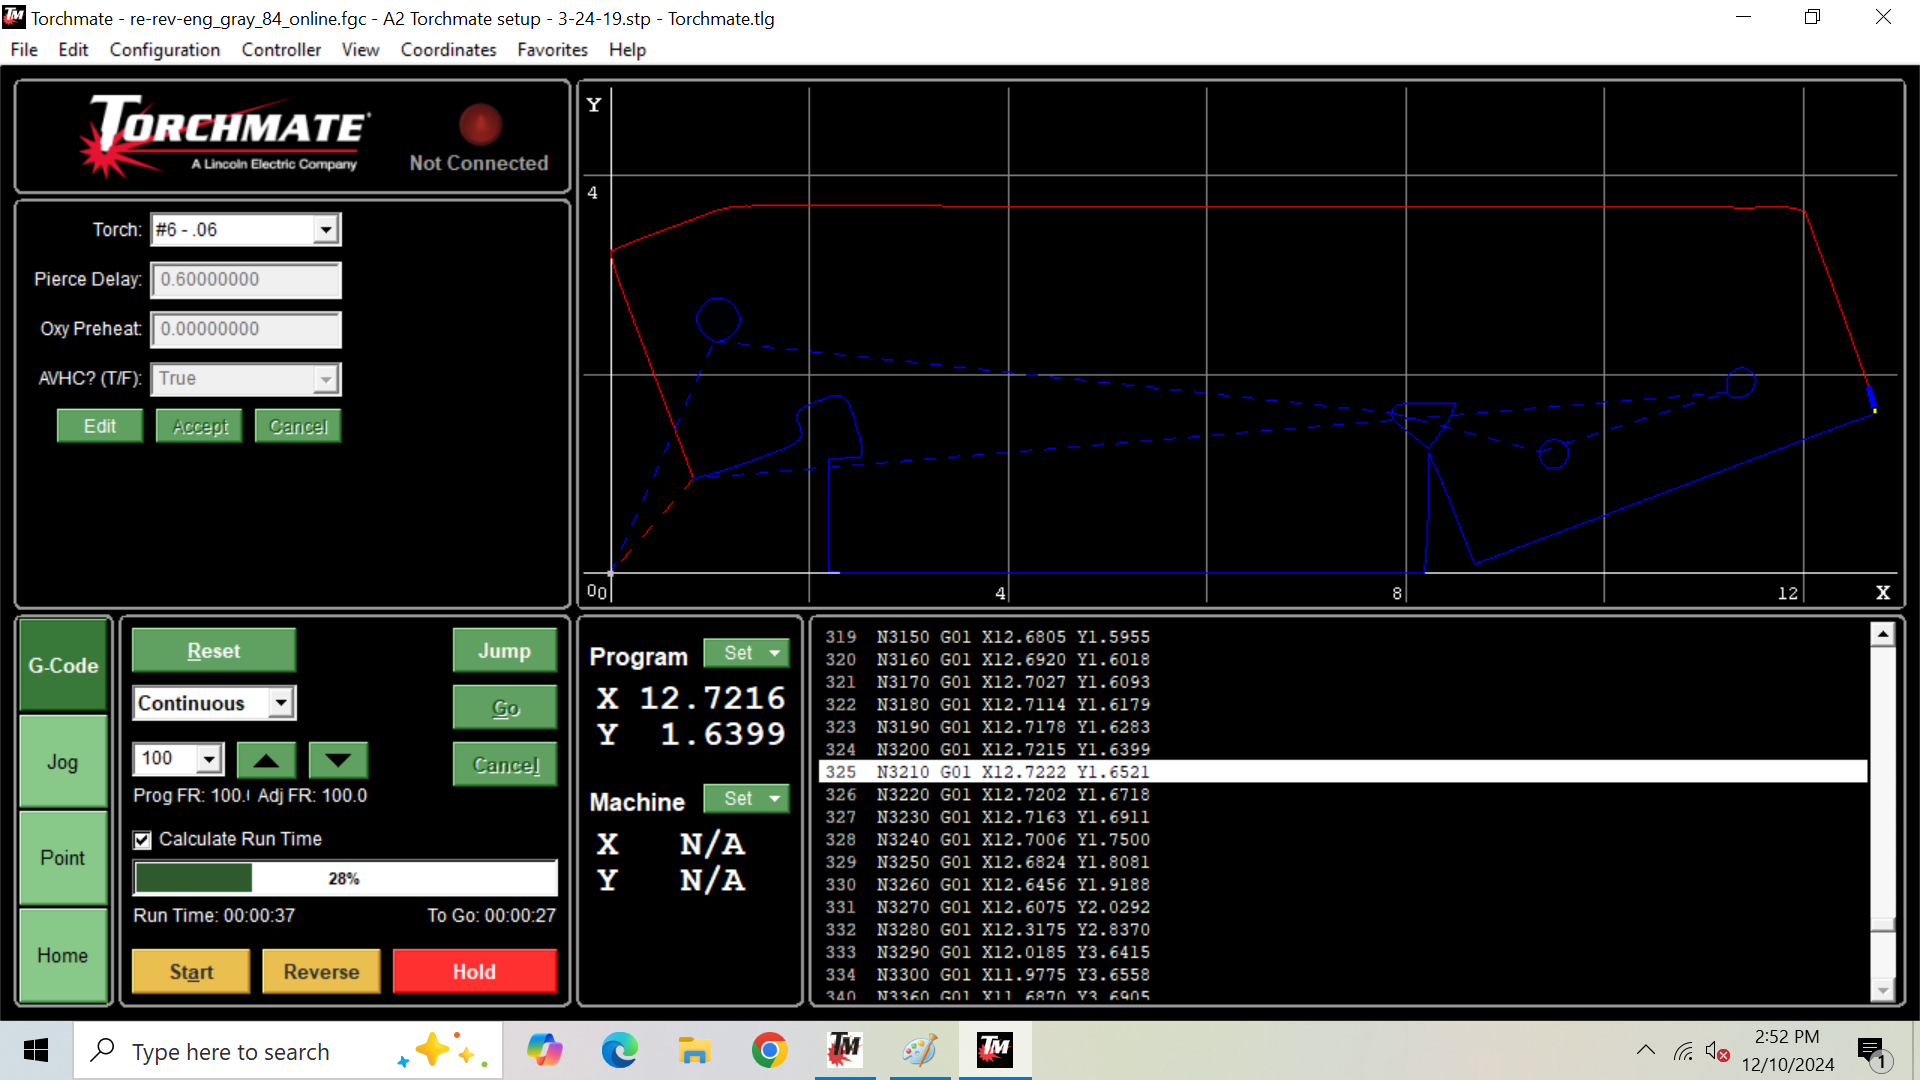
The driver software doesn't give us a display of the overall dimensions of the tool path but we can find the maximum X-coordinate (highlighted) in the G-Code listing. Note that it is still equal to 12.722 (the minimum X being equal to zero.)
The image with a white background is scanned to a contour with overall length 12.609 inches. We need to make it larger than this, so we can convert it to a "Male" tool path which adds 0.059 inches to its length. We then incorporate it into the Torchmate driver software. If we interrogate the data with no additional tool offset, we find the span to be 12.667. Therefore, we shall re-import the DXF file into the Torchmate driver with a tool offset of 0.06 inches to the outside of the path. This is done by selecting Tool #6, with the pull-down menu saying "Outside." The overall length of the path is found to become 12.727 inches.
Finally, we can process the worst of the set of images. The overall length of the contour is 12.790. We export it as an "Online" tool path and then import it into the Torchmate driver with Tool #6 with the pulldown option set to "Inside." When this is done and we interrogate the data we find the path has an overall length of 12.728 inches.
The two stages of tool compensation withing the Torchmate utilities are more than enough to correct the size of different scans of the part.
Conclusion
We have shown that by photographing a flat pattern on a camera stand, we can render parts larger than those that can be scanned on a flatbed scanner. Using the method outlined above there is ample opportunity to measure any errors in linear dimension and to correct them in process. Scanning errors in the details can be corrected when the data is in the form of a bitmap, using as utility program as basic as "Paint."
Having created an accurate DXF file in this tutorial, the example part can be cut, bent and finished using the method outlined in Solidworks Tutorial 2b.
